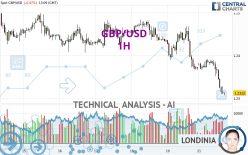
GBP/USD - 1H - Technical analysis published on 04/22/2024 (GMT)
- 77
- 0
Click here for a new analysis!
- Timeframe : 1H
- - Analysis generated on
- Status : INVALID

Summary of the analysis

Additional analysis
Quotes
The GBP/USD price is 1.2312 USD. The price registered a decrease of -0.47% on the session with the lowest point at 1.2307 USD and the highest point at 1.2392 USD. The deviation from the price is +0.04% for the low point and -0.65% for the high point.The Central Gaps scanner detects a bullish opening marking the presence of buyers ahead of sellers at the opening but not sufficiently marked to allow the price to register a quotation gap.
Bullish opening
Type : Bullish
Timeframe : Openning
So that you have an overall view of the price change, here is a table showing the variations over several periods:
Near a new LOW record (1 year)
Type : Bearish
Timeframe : Weekly
Near a new HIGH record (1st january)
Type : Bullish
Timeframe : Weekly
New LOW record (1st january)
Type : Bearish
Timeframe : Weekly
Near a new HIGH record (1 month)
Type : Bullish
Timeframe : Weekly
New LOW record (1 month)
Type : Bearish
Timeframe : Weekly
Technical
Technical analysis of this 1H chart of GBP/USD indicates that the overall trend is strongly bearish. 92.86% of the signals given by moving averages are bearish. This strongly bearish trend is supported by the strong bearish signals given by short-term moving averages. There is no crossing of moving average by the price or crossing of moving averages between themselves.
The probability of a further decline is high given the direction of the technical indicators.
Caution: the Central Indicators scanner currently detects an excess:
RSI indicator is oversold : under 30
Type : Neutral
Timeframe : 1 hour
CCI indicator is oversold : under -100
Type : Neutral
Timeframe : 1 hour
Previous candle closed under Bollinger bands
Type : Neutral
Timeframe : 1 hour
Williams %R indicator is oversold : under -80
Type : Neutral
Timeframe : 1 hour
Pivot points : price is under support 1
Type : Neutral
Timeframe : 1 hour
Pivot points : price is under support 1
Type : Neutral
Timeframe : Weekly
An analysis of the price chart with the Central Patterns scanner (detector of chart patterns and resistances and supports) shows several results that can have an impact on the price change:
Near horizontal support
Type : Bullish
Timeframe : 1 hour
Support of channel is broken
Type : Bearish
Timeframe : 1 hour
There is also a Japanese candlestick pattern detected by Central Candlesticks that could mark the end of the current short-term trend:
Doji
Type : Neutral
Timeframe : 1 hour
| S3 | S2 | S1 | Price | R1 | R2 | R3 | |
|---|---|---|---|---|---|---|---|
| ProTrendLines | 1.0726 | 1.2044 | 1.2249 | 1.2312 | 1.2315 | 1.2418 | 1.2483 |
| Change (%) | -12.88% | -2.18% | -0.51% | - | +0.02% | +0.86% | +1.39% |
| Change | -0.1586 | -0.0268 | -0.0063 | - | +0.0003 | +0.0106 | +0.0171 |
| Level | Intermediate | Major | Minor | - | Minor | Intermediate | Major |
Attention could also be paid to pivot points to set price objectives:
| Pivot points | S3 | S2 | S1 | PP | R1 | R2 | R3 |
|---|---|---|---|---|---|---|---|
| Standard | 1.2233 | 1.2299 | 1.2335 | 1.2401 | 1.2437 | 1.2503 | 1.2539 |
| Camarilla | 1.2342 | 1.2351 | 1.2361 | 1.2370 | 1.2379 | 1.2389 | 1.2398 |
| Woodie | 1.2217 | 1.2292 | 1.2319 | 1.2394 | 1.2421 | 1.2496 | 1.2523 |
| Fibonacci | 1.2299 | 1.2338 | 1.2362 | 1.2401 | 1.2440 | 1.2464 | 1.2503 |
| Pivot points | S3 | S2 | S1 | PP | R1 | R2 | R3 |
|---|---|---|---|---|---|---|---|
| Standard | 1.2191 | 1.2279 | 1.2324 | 1.2412 | 1.2457 | 1.2545 | 1.2590 |
| Camarilla | 1.2333 | 1.2346 | 1.2358 | 1.2370 | 1.2382 | 1.2394 | 1.2407 |
| Woodie | 1.2171 | 1.2268 | 1.2304 | 1.2401 | 1.2437 | 1.2534 | 1.2570 |
| Fibonacci | 1.2279 | 1.2330 | 1.2361 | 1.2412 | 1.2463 | 1.2494 | 1.2545 |
| Pivot points | S3 | S2 | S1 | PP | R1 | R2 | R3 |
|---|---|---|---|---|---|---|---|
| Standard | 1.2176 | 1.2376 | 1.2495 | 1.2695 | 1.2814 | 1.3014 | 1.3133 |
| Camarilla | 1.2527 | 1.2557 | 1.2586 | 1.2615 | 1.2644 | 1.2674 | 1.2703 |
| Woodie | 1.2137 | 1.2356 | 1.2456 | 1.2675 | 1.2775 | 1.2994 | 1.3094 |
| Fibonacci | 1.2376 | 1.2498 | 1.2573 | 1.2695 | 1.2817 | 1.2892 | 1.3014 |
Numerical data
The following is the status of technical indicators and moving averages registered at the time this technical analysis was created:
| RSI (14): | 22.05 | |
| MACD (12,26,9): | -0.0024 | |
| Directional Movement: | -28.8297 | |
| AROON (14): | -64.2857 | |
| DEMA (21): | 1.2331 | |
| Parabolic SAR (0,02-0,02-0,2): | 1.2355 | |
| Elder Ray (13): | -0.0036 | |
| Super Trend (3,10): | 1.2358 | |
| Zig ZAG (10): | 1.2310 | |
| VORTEX (21): | 0.7526 | |
| Stochastique (14,3,5): | 4.02 | |
| TEMA (21): | 1.2320 | |
| Williams %R (14): | -98.80 | |
| Chande Momentum Oscillator (20): | -0.0078 | |
| Repulse (5,40,3): | -0.2470 | |
| ROCnROLL: | 2 | |
| TRIX (15,9): | -0.0212 | |
| Courbe Coppock: | 0.68 |
| MA7: | 1.2412 | |
| MA20: | 1.2542 | |
| MA50: | 1.2630 | |
| MA100: | 1.2652 | |
| MAexp7: | 1.2330 | |
| MAexp20: | 1.2360 | |
| MAexp50: | 1.2392 | |
| MAexp100: | 1.2422 | |
| Price / MA7: | -0.81% | |
| Price / MA20: | -1.83% | |
| Price / MA50: | -2.52% | |
| Price / MA100: | -2.69% | |
| Price / MAexp7: | -0.15% | |
| Price / MAexp20: | -0.39% | |
| Price / MAexp50: | -0.65% | |
| Price / MAexp100: | -0.89% |
News
Don't forget to follow the news on GBP/USD. At the time of publication of this analysis, the latest news was as follows:
-
 GBP/USD Forecast April 22, 2024
-
Technical Analysis: 03/04/2024 - GBPUSD battles with 200-day SMA
-
Technical Analysis: 26/03/2024 - GBPUSD bounces off 200-day SMA
-
Trade of the week: short GBP/USD
-
Trading the trend: long GBP/USD
About author

Online


Add a comment
Comments
0 comments on the analysis GBP/USD - 1H