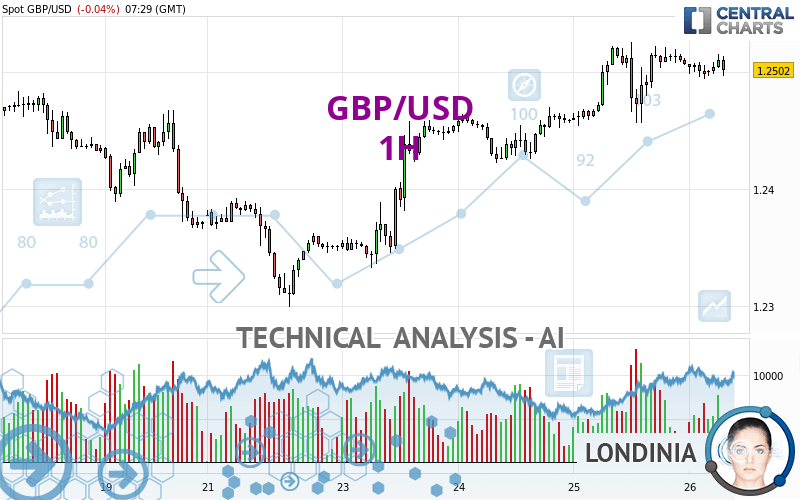
GBP/USD - 1H - Technical analysis published on 04/26/2024 (GMT)
- Who voted?
- 77
- 0
Click here for a new analysis!
- Timeframe : 1H
- - Analysis generated on
- Status : INVALID

Summary of the analysis

Additional analysis
Quotes
The GBP/USD rating is 1.2502 USD. The price is lower by -0.04% since the last closing and was between 1.2494 USD and 1.2516 USD. This implies that the price is at +0.06% from its lowest and at -0.11% from its highest.A study of price movements over other periods shows the following variations:
Near a new LOW record (1 year)
Type : Bearish
Timeframe : Weekly
Near a new HIGH record (1st january)
Type : Bullish
Timeframe : Weekly
Near a new HIGH record (1 month)
Type : Bullish
Timeframe : Weekly
Technical
Technical analysis of GBP/USD in 1H shows a strongly overall bullish trend. 82.14% of the signals given by moving averages are bullish. The slightly bullish signals given by the short-term moving averages indicate this trend is showing signs of running out of steam. The Central Indicators market scanner is currently detecting several bearish signals that could impact this trend:
Bearish price crossover with Moving Average 20
Type : Bearish
Timeframe : 1 hour
Bearish price crossover with adaptative moving average 20
Type : Bearish
Timeframe : 1 hour
Technical indicators are slightly bearish. There is therefore considerable uncertainty about the continuation of the decline.
Central Indicators, the scanner specialised in technical indicators, has identified these signals:
Pivot points : price is over resistance 1
Type : Neutral
Timeframe : Weekly
Aroon indicator bearish trend
Type : Bearish
Timeframe : 1 hour
Momentum indicator is back under 0
Type : Bearish
Timeframe : 1 hour
Williams %R indicator is back under -50
Type : Bearish
Timeframe : 1 hour
The Central Patterns scanner, which studies chart patterns, resistances and supports, has identified these signals:
Near resistance of channel
Type : Bearish
Timeframe : 1 hour
Near resistance of triangle
Type : Bearish
Timeframe : 1 hour
No result was found by the Central Candlesticks scanner on Japanese candlesticks.
| S3 | S2 | S1 | Price | R1 | R2 | R3 | |
|---|---|---|---|---|---|---|---|
| ProTrendLines | 1.2315 | 1.2418 | 1.2483 | 1.2502 | 1.2525 | 1.2548 | 1.2675 |
| Change (%) | -1.50% | -0.67% | -0.15% | - | +0.18% | +0.37% | +1.38% |
| Change | -0.0187 | -0.0084 | -0.0019 | - | +0.0023 | +0.0046 | +0.0173 |
| Level | Major | Major | Intermediate | - | Intermediate | Minor | Intermediate |
Pivot points can also be used to set your price objectives. Here is the price situation in relation to pivot points:
| Pivot points | S3 | S2 | S1 | PP | R1 | R2 | R3 |
|---|---|---|---|---|---|---|---|
| Standard | 1.2393 | 1.2424 | 1.2465 | 1.2496 | 1.2537 | 1.2568 | 1.2609 |
| Camarilla | 1.2487 | 1.2494 | 1.2500 | 1.2507 | 1.2514 | 1.2520 | 1.2527 |
| Woodie | 1.2399 | 1.2427 | 1.2471 | 1.2499 | 1.2543 | 1.2571 | 1.2615 |
| Fibonacci | 1.2424 | 1.2451 | 1.2468 | 1.2496 | 1.2523 | 1.2540 | 1.2568 |
| Pivot points | S3 | S2 | S1 | PP | R1 | R2 | R3 |
|---|---|---|---|---|---|---|---|
| Standard | 1.2191 | 1.2279 | 1.2324 | 1.2412 | 1.2457 | 1.2545 | 1.2590 |
| Camarilla | 1.2333 | 1.2346 | 1.2358 | 1.2370 | 1.2382 | 1.2394 | 1.2407 |
| Woodie | 1.2171 | 1.2268 | 1.2304 | 1.2401 | 1.2437 | 1.2534 | 1.2570 |
| Fibonacci | 1.2279 | 1.2330 | 1.2361 | 1.2412 | 1.2463 | 1.2494 | 1.2545 |
| Pivot points | S3 | S2 | S1 | PP | R1 | R2 | R3 |
|---|---|---|---|---|---|---|---|
| Standard | 1.2176 | 1.2376 | 1.2495 | 1.2695 | 1.2814 | 1.3014 | 1.3133 |
| Camarilla | 1.2527 | 1.2557 | 1.2586 | 1.2615 | 1.2644 | 1.2674 | 1.2703 |
| Woodie | 1.2137 | 1.2356 | 1.2456 | 1.2675 | 1.2775 | 1.2994 | 1.3094 |
| Fibonacci | 1.2376 | 1.2498 | 1.2573 | 1.2695 | 1.2817 | 1.2892 | 1.3014 |
Numerical data
The following is the status of technical indicators and moving averages registered at the time this technical analysis was created:
| RSI (14): | 53.39 | |
| MACD (12,26,9): | 0.0007 | |
| Directional Movement: | 5.2562 | |
| AROON (14): | -71.4286 | |
| DEMA (21): | 1.2512 | |
| Parabolic SAR (0,02-0,02-0,2): | 1.2473 | |
| Elder Ray (13): | 0.0002 | |
| Super Trend (3,10): | 1.2529 | |
| Zig ZAG (10): | 1.2501 | |
| VORTEX (21): | 0.9769 | |
| Stochastique (14,3,5): | 43.35 | |
| TEMA (21): | 1.2506 | |
| Williams %R (14): | -78.57 | |
| Chande Momentum Oscillator (20): | -0.0013 | |
| Repulse (5,40,3): | -0.0828 | |
| ROCnROLL: | -1 | |
| TRIX (15,9): | 0.0106 | |
| Courbe Coppock: | 0.02 |
| MA7: | 1.2439 | |
| MA20: | 1.2516 | |
| MA50: | 1.2622 | |
| MA100: | 1.2647 | |
| MAexp7: | 1.2503 | |
| MAexp20: | 1.2501 | |
| MAexp50: | 1.2481 | |
| MAexp100: | 1.2458 | |
| Price / MA7: | +0.51% | |
| Price / MA20: | -0.11% | |
| Price / MA50: | -0.95% | |
| Price / MA100: | -1.15% | |
| Price / MAexp7: | -0.01% | |
| Price / MAexp20: | +0.01% | |
| Price / MAexp50: | +0.17% | |
| Price / MAexp100: | +0.35% |
News
The latest news and videos published on GBP/USD at the time of the analysis were as follows:
-
 GBP/USD April 24 Forecast
-
GBP/USD Forecast April 22, 2024
-
Technical Analysis: 03/04/2024 - GBPUSD battles with 200-day SMA
-
Technical Analysis: 26/03/2024 - GBPUSD bounces off 200-day SMA
-
Trade of the week: short GBP/USD
About author

Online


Add a comment
Comments
0 comments on the analysis GBP/USD - 1H