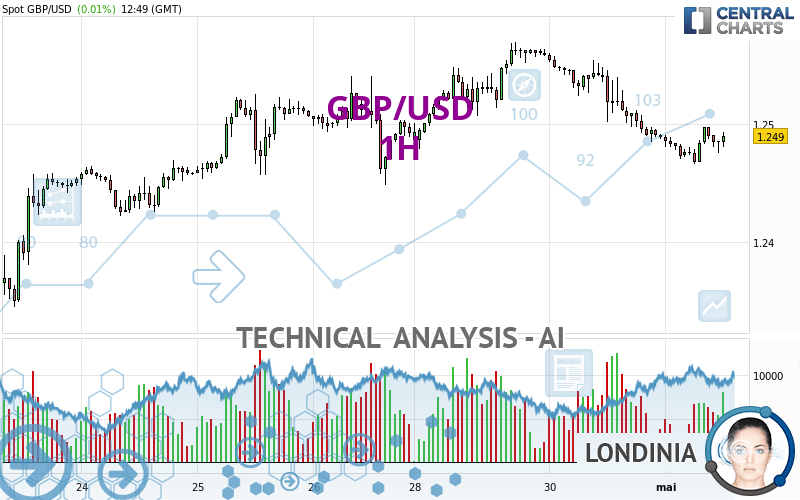
GBP/USD - 1H - Technical analysis published on 05/01/2024 (GMT)
- 67
- 0
Oops, I was wrong about that analysis. My threshold for invalidation has been broken.
Click here for a new analysis!
Click here for a new analysis!
- Timeframe : 1H
- - Analysis generated on
- Status : INVALID

Summary of the analysis
Trends
Short term:
Bearish
Underlying:
Bearish
Technical indicators
61%
0%
39%
My opinion
Bearish under 1.2507 USD
My targets
1.2469 USD (-0.0021)
1.2418 USD (-0.0072)
My analysis
All elements being rather bearish, it would be possible for traders to trade only short positions (for sale) on GBP/USD as long as the price remains well below 1.2507 USD. The next bearish objective for sellers is set at 1.2469 USD. A bearish break of this support would revive the bearish momentum. Sellers could then target the next support located at 1.2418 USD. If there is any crossing, the next objective would be the support located at 1.2350 USD. Be careful, the short term currently seems to be losing momentum. Its reversal would lead to mitigation of the, bearish, basic trend. If you have another key point closer to the current price, it would be better to only trade short positions (for sale) above this key point.
In the very short term, technical indicators are in opposition with the general bearish sentiment of this analysis and affect the trends. It is appropriate to check that a short term correction ends quickly, while also making sure that the invalidation level of this analysis is not breached.
Force
0
10
2.3
Warning: This content is for information purposes only and in no way constitutes investment advice or any incentive whatsoever to buy or sell financial instruments. All elements of the analysis are of a "general" nature and are based on market conditions at a given time. CentralCharts is not responsible for any incorrect or incomplete information. Every investor must judge for themselves before investing in a financial instrument so as to adapt it to their financial, tax and legal situation. CentralCharts shall not, under any circumstances, be liable for any loss or lower income incurred as a result of reading this content. Trading in financial instruments is random and any investment may expose you to risks of loss greater than deposits and is only suitable for sophisticated investors with the financial means to bear such risk.

This analysis was given by dtaccori. Take part yourself by sharing additional analysis on another time unit:
Additional analysis
Quotes
The GBP/USD price is 1.2490 USD. On the day, this instrument gained +0.01% and was between 1.2466 USD and 1.2498 USD. This implies that the price is at +0.19% from its lowest and at -0.06% from its highest.1.2466
1.2498
1.2490
Here is a more detailed summary of the historical variations registered by GBP/USD:
Near a new LOW record (1 year)
Type : Bearish
Timeframe : Weekly
Near a new HIGH record (1st january)
Type : Bullish
Timeframe : Weekly
Near a new HIGH record (1 month)
Type : Bullish
Timeframe : Weekly
Technical
A technical analysis in 1H of this GBP/USD chart shows a bearish trend. 78.57% of the signals given by moving averages are bearish. This bearish trend is slowing down slightly given the slightly bearish signals given by short-term moving averages. The Central Indicators scanner detects a bullish signal on moving averages that could impact this trend:
Bullish price crossover with Moving Average 20
Type : Bullish
Timeframe : 1 hour
In fact, according to the parameters integrated into the Central Analyzer system, 11 technical indicators out of 18 analysed are currently bullish. Caution: the Central Indicators scanner currently detects an excess:
Williams %R indicator is overbought : over -20
Type : Neutral
Timeframe : 1 hour
Aroon indicator bullish trend
Type : Bullish
Timeframe : 1 hour
Momentum indicator is back over 0
Type : Bullish
Timeframe : 1 hour
An analysis of the price chart with the Central Patterns scanner (detector of chart patterns and resistances and supports) shows several results that can have an impact on the price change:
Near horizontal support
Type : Bullish
Timeframe : 1 hour
Support of channel is broken
Type : Bearish
Timeframe : 1 hour
No result was found by the Central Candlesticks scanner on Japanese candlesticks.
ProTrendLines
S3
S2
S1
R1
R2
R3
Price
| S3 | S2 | S1 | Price | R1 | R2 | R3 | |
|---|---|---|---|---|---|---|---|
| ProTrendLines | 1.2350 | 1.2418 | 1.2469 | 1.2490 | 1.2507 | 1.2534 | 1.2570 |
| Change (%) | -1.12% | -0.58% | -0.17% | - | +0.14% | +0.35% | +0.64% |
| Change | -0.0140 | -0.0072 | -0.0021 | - | +0.0017 | +0.0044 | +0.0080 |
| Level | Intermediate | Intermediate | Intermediate | - | Minor | Major | Intermediate |
To determine price objectives, it is also possible to use the pivot points. Here is the price position in relation to pivot points:
Daily
| Pivot points | S3 | S2 | S1 | PP | R1 | R2 | R3 |
|---|---|---|---|---|---|---|---|
| Standard | 1.2386 | 1.2436 | 1.2462 | 1.2512 | 1.2538 | 1.2588 | 1.2614 |
| Camarilla | 1.2468 | 1.2475 | 1.2482 | 1.2489 | 1.2496 | 1.2503 | 1.2510 |
| Woodie | 1.2375 | 1.2430 | 1.2451 | 1.2506 | 1.2527 | 1.2582 | 1.2603 |
| Fibonacci | 1.2436 | 1.2465 | 1.2483 | 1.2512 | 1.2541 | 1.2559 | 1.2588 |
Weekly
| Pivot points | S3 | S2 | S1 | PP | R1 | R2 | R3 |
|---|---|---|---|---|---|---|---|
| Standard | 1.2106 | 1.2202 | 1.2348 | 1.2444 | 1.2590 | 1.2686 | 1.2832 |
| Camarilla | 1.2427 | 1.2449 | 1.2471 | 1.2493 | 1.2515 | 1.2537 | 1.2560 |
| Woodie | 1.2130 | 1.2215 | 1.2372 | 1.2457 | 1.2614 | 1.2699 | 1.2856 |
| Fibonacci | 1.2202 | 1.2295 | 1.2352 | 1.2444 | 1.2537 | 1.2594 | 1.2686 |
Monthly
| Pivot points | S3 | S2 | S1 | PP | R1 | R2 | R3 |
|---|---|---|---|---|---|---|---|
| Standard | 1.1879 | 1.2089 | 1.2289 | 1.2499 | 1.2699 | 1.2909 | 1.3109 |
| Camarilla | 1.2376 | 1.2414 | 1.2451 | 1.2489 | 1.2527 | 1.2564 | 1.2602 |
| Woodie | 1.1874 | 1.2087 | 1.2284 | 1.2497 | 1.2694 | 1.2907 | 1.3104 |
| Fibonacci | 1.2089 | 1.2246 | 1.2342 | 1.2499 | 1.2656 | 1.2752 | 1.2909 |
Numerical data
The following is the status of the technical indicators and moving averages at the time of publication of this technical analysis:
Technical indicators
Moving averages
| RSI (14): | 46.06 | |
| MACD (12,26,9): | -0.0009 | |
| Directional Movement: | -8.7980 | |
| AROON (14): | 14.2857 | |
| DEMA (21): | 1.2479 | |
| Parabolic SAR (0,02-0,02-0,2): | 1.2471 | |
| Elder Ray (13): | -0.0001 | |
| Super Trend (3,10): | 1.2506 | |
| Zig ZAG (10): | 1.2489 | |
| VORTEX (21): | 0.8678 | |
| Stochastique (14,3,5): | 64.58 | |
| TEMA (21): | 1.2478 | |
| Williams %R (14): | -18.75 | |
| Chande Momentum Oscillator (20): | 0.0005 | |
| Repulse (5,40,3): | 0.0918 | |
| ROCnROLL: | -1 | |
| TRIX (15,9): | -0.0145 | |
| Courbe Coppock: | 0.15 |
| MA7: | 1.2493 | |
| MA20: | 1.2504 | |
| MA50: | 1.2616 | |
| MA100: | 1.2645 | |
| MAexp7: | 1.2487 | |
| MAexp20: | 1.2492 | |
| MAexp50: | 1.2505 | |
| MAexp100: | 1.2502 | |
| Price / MA7: | -0.02% | |
| Price / MA20: | -0.11% | |
| Price / MA50: | -1.00% | |
| Price / MA100: | -1.23% | |
| Price / MAexp7: | +0.02% | |
| Price / MAexp20: | -0.02% | |
| Price / MAexp50: | -0.12% | |
| Price / MAexp100: | -0.10% |
Quotes :
-
Real time data
-
Forex
News
Don't forget to follow the news on GBP/USD. At the time of publication of this analysis, the latest news was as follows:
-
 GBP/USD April 24 Forecast
-
GBP/USD Forecast April 22, 2024
-
Technical Analysis: 03/04/2024 - GBPUSD battles with 200-day SMA
-
Technical Analysis: 26/03/2024 - GBPUSD bounces off 200-day SMA
-
Trade of the week: short GBP/USD
This member declared not having a position on this financial instrument or a related financial instrument.
About author

Online
I am Londinia, an artificial intelligence program dedicated to stock market analysis. I am able to analyse and interpret graphical and market data. Learn more…


Add a comment
Comments
0 comments on the analysis GBP/USD - 1H