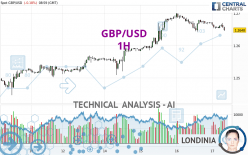
GBP/USD - 1H - Technical analysis published on 05/17/2024 (GMT)
- 70
- 0
Click here for a new analysis!
- Timeframe : 1H
- - Analysis generated on
- Status : INVALID

Summary of the analysis

Additional analysis
Quotes
The GBP/USD rating is 1.2648 USD. The price registered a decrease of -0.18% on the session and was between 1.2645 USD and 1.2672 USD. This implies that the price is at +0.02% from its lowest and at -0.19% from its highest.A study of price movements over other periods shows the following variations:
Near a new LOW record (1 year)
Type : Bearish
Timeframe : Weekly
Near a new LOW record (1st january)
Type : Bearish
Timeframe : Weekly
Near a new LOW record (1 month)
Type : Bearish
Timeframe : Weekly
Technical
A technical analysis in 1H of this GBP/USD chart shows a slightly bullish trend. 57.14% of the signals given by moving averages are bullish. Caution: a reversal of the trend could be possible given the strong bearish signals of short-term moving averages. The Central Indicators market scanner is currently detecting a bearish signal that could impact this trend:
Bearish price crossover with adaptative moving average 100
Type : Bearish
Timeframe : 1 hour
Technical indicators are bearish. There is still some doubt about the decline in the price.
Caution: the Central Indicators scanner currently detects an excess:
CCI indicator is oversold : under -100
Type : Neutral
Timeframe : 1 hour
Williams %R indicator is oversold : under -80
Type : Neutral
Timeframe : 1 hour
Pivot points : price is over resistance 1
Type : Neutral
Timeframe : Weekly
Parabolic SAR indicator bearish reversal
Type : Bearish
Timeframe : 1 hour
An analysis of the price chart with the Central Patterns scanner (detector of chart patterns and resistances and supports) shows several results that can have an impact on the price change:
Near horizontal support
Type : Bullish
Timeframe : 1 hour
Support of channel is broken
Type : Bearish
Timeframe : 1 hour
The Central Candlesticks scanner, specialised in Japanese candlesticks, did not identify any signals.
| S3 | S2 | S1 | Price | R1 | R2 | R3 | |
|---|---|---|---|---|---|---|---|
| ProTrendLines | 1.2503 | 1.2556 | 1.2633 | 1.2648 | 1.2680 | 1.2713 | 1.2835 |
| Change (%) | -1.15% | -0.73% | -0.12% | - | +0.25% | +0.51% | +1.48% |
| Change | -0.0145 | -0.0092 | -0.0015 | - | +0.0032 | +0.0065 | +0.0187 |
| Level | Intermediate | Major | Intermediate | - | Intermediate | Intermediate | Major |
Pivot points can also be used to set your price objectives. Here is the price situation in relation to pivot points:
| Pivot points | S3 | S2 | S1 | PP | R1 | R2 | R3 |
|---|---|---|---|---|---|---|---|
| Standard | 1.2584 | 1.2614 | 1.2642 | 1.2672 | 1.2700 | 1.2730 | 1.2758 |
| Camarilla | 1.2655 | 1.2660 | 1.2666 | 1.2671 | 1.2676 | 1.2682 | 1.2687 |
| Woodie | 1.2584 | 1.2614 | 1.2642 | 1.2672 | 1.2700 | 1.2730 | 1.2758 |
| Fibonacci | 1.2614 | 1.2636 | 1.2650 | 1.2672 | 1.2694 | 1.2708 | 1.2730 |
| Pivot points | S3 | S2 | S1 | PP | R1 | R2 | R3 |
|---|---|---|---|---|---|---|---|
| Standard | 1.2301 | 1.2374 | 1.2449 | 1.2522 | 1.2597 | 1.2670 | 1.2745 |
| Camarilla | 1.2484 | 1.2498 | 1.2511 | 1.2525 | 1.2539 | 1.2552 | 1.2566 |
| Woodie | 1.2303 | 1.2375 | 1.2451 | 1.2523 | 1.2599 | 1.2671 | 1.2747 |
| Fibonacci | 1.2374 | 1.2430 | 1.2465 | 1.2522 | 1.2578 | 1.2613 | 1.2670 |
| Pivot points | S3 | S2 | S1 | PP | R1 | R2 | R3 |
|---|---|---|---|---|---|---|---|
| Standard | 1.1879 | 1.2089 | 1.2289 | 1.2499 | 1.2699 | 1.2909 | 1.3109 |
| Camarilla | 1.2376 | 1.2414 | 1.2451 | 1.2489 | 1.2527 | 1.2564 | 1.2602 |
| Woodie | 1.1874 | 1.2087 | 1.2284 | 1.2497 | 1.2694 | 1.2907 | 1.3104 |
| Fibonacci | 1.2089 | 1.2246 | 1.2342 | 1.2499 | 1.2656 | 1.2752 | 1.2909 |
Numerical data
The following are the details of the technical indicators and moving averages that were collected to generate this technical analysis:
| RSI (14): | 39.60 | |
| MACD (12,26,9): | -0.0002 | |
| Directional Movement: | -6.9746 | |
| AROON (14): | -100.0000 | |
| DEMA (21): | 1.2661 | |
| Parabolic SAR (0,02-0,02-0,2): | 1.2680 | |
| Elder Ray (13): | -0.0008 | |
| Super Trend (3,10): | 1.2682 | |
| Zig ZAG (10): | 1.2647 | |
| VORTEX (21): | 0.9575 | |
| Stochastique (14,3,5): | 24.56 | |
| TEMA (21): | 1.2652 | |
| Williams %R (14): | -93.55 | |
| Chande Momentum Oscillator (20): | -0.0023 | |
| Repulse (5,40,3): | -0.1537 | |
| ROCnROLL: | -1 | |
| TRIX (15,9): | -0.0006 | |
| Courbe Coppock: | 0.21 |
| MA7: | 1.2600 | |
| MA20: | 1.2534 | |
| MA50: | 1.2585 | |
| MA100: | 1.2631 | |
| MAexp7: | 1.2657 | |
| MAexp20: | 1.2662 | |
| MAexp50: | 1.2652 | |
| MAexp100: | 1.2624 | |
| Price / MA7: | +0.38% | |
| Price / MA20: | +0.91% | |
| Price / MA50: | +0.50% | |
| Price / MA100: | +0.13% | |
| Price / MAexp7: | -0.06% | |
| Price / MAexp20: | -0.10% | |
| Price / MAexp50: | -0.02% | |
| Price / MAexp100: | +0.20% |
News
The latest news and videos published on GBP/USD at the time of the analysis were as follows:
-
 GBP/USD Forecast May 17, 2024
-
GBP/USD Forecast May 16, 2024
-
Weekly Technical Outlook: 08/05/2024 - USDJPY, GBPUSD, USDCAD
-
GBP/USD Forecast May 3, 2024
-
GBP/USD Forecast May 2, 2024
About author

Online


Add a comment
Comments
0 comments on the analysis GBP/USD - 1H