GBP/USD - Maintaining its upward trend - 07/02/2015 (GMT)
- Who voted?
- 459
- 0
- Timeframe : 30 min.
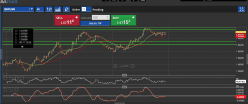

GBP/USD Chart
Are you looking for opportunities in indices and forex?
DISCOVER LONDINIA OPPORTUNITIES...
DISCOVER LONDINIA OPPORTUNITIES...
The GBP/USD pair is trading above its upward trend line on a 4 hour time frame. This confirms that the bias still stays towards the upside. The price is trading below the 50 day shown in yellow and above its 100 day shown in red moving averages. If the price crosses the 50 day moving averages and stays above this, it will be a further confirmation of bull trend.
The RSI and MACD are trading near their extreme zones especially the MACD indicator. If we see a divergence between these indicators and the price action then it reflects the weakness in the trend.
The RSI and MACD are trading near their extreme zones especially the MACD indicator. If we see a divergence between these indicators and the price action then it reflects the weakness in the trend.
This member did not declare if he had a position on this financial instrument or a related financial instrument.
About author

Offline


Add a comment
Comments
0 comments on the analysis GBP/USD - 30 min.