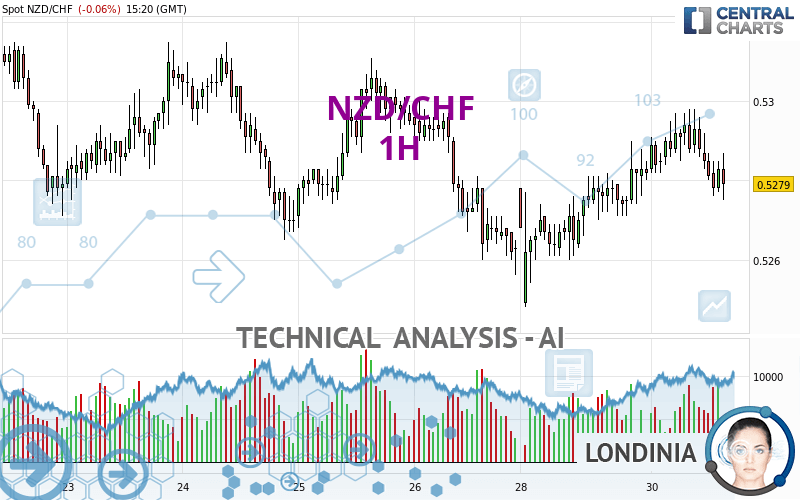
NZD/CHF - 1H - Technical analysis published on 01/30/2024 (GMT)
- 91
- 0
- Timeframe : 1H
- - Analysis generated on
- Status : NEUTRAL

Summary of the analysis

Additional analysis
Quotes
The NZD/CHF rating is 0.5279 CHF. The price is lower by -0.06% since the last closing with the lowest point at 0.5275 CHF and the highest point at 0.5298 CHF. The deviation from the price is +0.08% for the low point and -0.36% for the high point.The Central Gaps scanner detects a bullish opening. A small advantage for buyers in the very short term.
Bullish opening
Type : Bullish
Timeframe : Openning
So that you have an overall view of the price change, here is a table showing the variations over several periods:
Near a new LOW record (5 years)
Type : Bearish
Timeframe : Weekly
Near a new LOW record (1 year)
Type : Bearish
Timeframe : Weekly
Near a new HIGH record (1st january)
Type : Bullish
Timeframe : Weekly
Near a new HIGH record (1 month)
Type : Bullish
Timeframe : Weekly
Technical
Technical analysis of this 1H chart of NZD/CHF indicates that the overall trend is slightly bearish. 60.71% of the signals given by moving averages are bullish. As the signals currently given by short-term moving averages are rather neutral, the overall trend could quickly return to neutral as well. An assessment of moving averages reveals several bearish signals that could impact this trend:
Bearish price crossover with Moving Average 50
Type : Bearish
Timeframe : 1 hour
Bearish price crossover with Moving Average 100
Type : Bearish
Timeframe : 1 hour
Bearish price crossover with adaptative moving average 20
Type : Bearish
Timeframe : 1 hour
In fact, only 9 technical indicators out of 18 studied are currently bearish. Caution: the Central Indicators scanner currently detects an excess:
CCI indicator is oversold : under -100
Type : Neutral
Timeframe : 1 hour
Williams %R indicator is oversold : under -80
Type : Neutral
Timeframe : 1 hour
RSI indicator is back over 50
Type : Bullish
Timeframe : 1 hour
The Central Patterns scanner, which studies chart patterns, resistances and supports, has identified this signal:
Near support of channel
Type : Bullish
Timeframe : 1 hour
The Central Candlesticks scanner, specialised in Japanese candlesticks, did not identify any signals.
| S3 | S2 | S1 | Price | R1 | R2 | R3 | |
|---|---|---|---|---|---|---|---|
| ProTrendLines | 0.5248 | 0.5265 | 0.5271 | 0.5279 | 0.5281 | 0.5290 | 0.5298 |
| Change (%) | -0.59% | -0.27% | -0.15% | - | +0.04% | +0.21% | +0.36% |
| Change | -0.0031 | -0.0014 | -0.0008 | - | +0.0002 | +0.0011 | +0.0019 |
| Level | Minor | Minor | Intermediate | - | Minor | Intermediate | Major |
To determine price objectives, it is also possible to use the pivot points. Here is the price position in relation to pivot points:
| Pivot points | S3 | S2 | S1 | PP | R1 | R2 | R3 |
|---|---|---|---|---|---|---|---|
| Standard | 0.5215 | 0.5231 | 0.5257 | 0.5273 | 0.5299 | 0.5315 | 0.5341 |
| Camarilla | 0.5271 | 0.5274 | 0.5278 | 0.5282 | 0.5286 | 0.5290 | 0.5294 |
| Woodie | 0.5219 | 0.5234 | 0.5261 | 0.5276 | 0.5303 | 0.5318 | 0.5345 |
| Fibonacci | 0.5231 | 0.5247 | 0.5257 | 0.5273 | 0.5289 | 0.5299 | 0.5315 |
| Pivot points | S3 | S2 | S1 | PP | R1 | R2 | R3 |
|---|---|---|---|---|---|---|---|
| Standard | 0.5166 | 0.5211 | 0.5237 | 0.5282 | 0.5308 | 0.5353 | 0.5379 |
| Camarilla | 0.5244 | 0.5250 | 0.5257 | 0.5263 | 0.5270 | 0.5276 | 0.5283 |
| Woodie | 0.5157 | 0.5206 | 0.5228 | 0.5277 | 0.5299 | 0.5348 | 0.5370 |
| Fibonacci | 0.5211 | 0.5238 | 0.5255 | 0.5282 | 0.5309 | 0.5326 | 0.5353 |
| Pivot points | S3 | S2 | S1 | PP | R1 | R2 | R3 |
|---|---|---|---|---|---|---|---|
| Standard | 0.5094 | 0.5187 | 0.5252 | 0.5345 | 0.5410 | 0.5503 | 0.5568 |
| Camarilla | 0.5275 | 0.5289 | 0.5304 | 0.5318 | 0.5333 | 0.5347 | 0.5362 |
| Woodie | 0.5081 | 0.5180 | 0.5239 | 0.5338 | 0.5397 | 0.5496 | 0.5555 |
| Fibonacci | 0.5187 | 0.5247 | 0.5284 | 0.5345 | 0.5405 | 0.5442 | 0.5503 |
Numerical data
The following are the details of the technical indicators and moving averages that were collected to generate this technical analysis:
| RSI (14): | 44.93 | |
| MACD (12,26,9): | 0.0001 | |
| Directional Movement: | 2.7806 | |
| AROON (14): | -50.0000 | |
| DEMA (21): | 0.5285 | |
| Parabolic SAR (0,02-0,02-0,2): | 0.5295 | |
| Elder Ray (13): | -0.0003 | |
| Super Trend (3,10): | 0.5268 | |
| Zig ZAG (10): | 0.5277 | |
| VORTEX (21): | 1.0213 | |
| Stochastique (14,3,5): | 15.09 | |
| TEMA (21): | 0.5285 | |
| Williams %R (14): | -82.61 | |
| Chande Momentum Oscillator (20): | -0.0012 | |
| Repulse (5,40,3): | -0.1849 | |
| ROCnROLL: | 2 | |
| TRIX (15,9): | 0.0086 | |
| Courbe Coppock: | 0.04 |
| MA7: | 0.5282 | |
| MA20: | 0.5297 | |
| MA50: | 0.5342 | |
| MA100: | 0.5340 | |
| MAexp7: | 0.5283 | |
| MAexp20: | 0.5283 | |
| MAexp50: | 0.5281 | |
| MAexp100: | 0.5283 | |
| Price / MA7: | -0.06% | |
| Price / MA20: | -0.34% | |
| Price / MA50: | -1.18% | |
| Price / MA100: | -1.14% | |
| Price / MAexp7: | -0.09% | |
| Price / MAexp20: | -0.09% | |
| Price / MAexp50: | -0.06% | |
| Price / MAexp100: | -0.09% |
News
The last news published on NZD/CHF at the time of the generation of this analysis was as follows:
About author
Online


Add a comment
Comments
0 comments on the analysis NZD/CHF - 1H