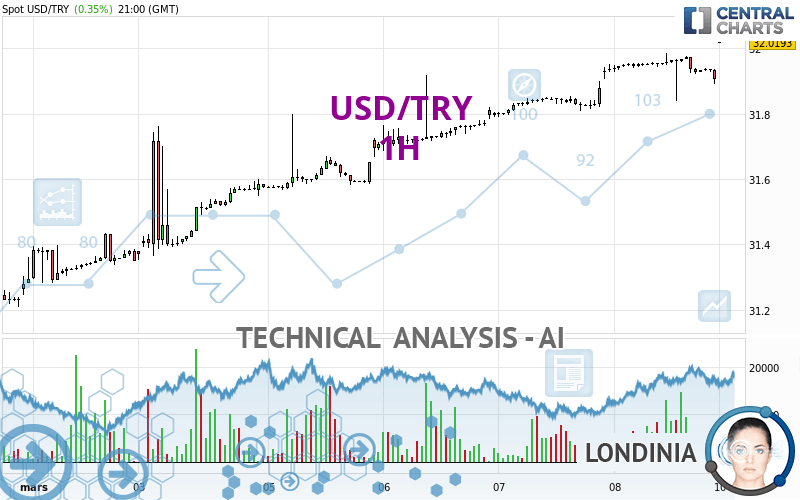
USD/TRY - 1H - Technical analysis published on 03/10/2024 (GMT)
- 96
- 0
Click here for a new analysis!
- Timeframe : 1H
- - Analysis generated on
- Status : TARGET REACHED

Summary of the analysis

Additional analysis
Quotes
The USD/TRY price is 32.0193 TRY. The price registered an increase of +0.35% on the session and was traded between 32.0193 TRY and 32.0193 TRY over the period. The price is currently at 0% from its lowest and 0% from its highest.A bullish opening was detected by the Central Gaps scanner. Buyers are trying to impose a bullish momentum in the very short term.
Bullish opening
Type : Bullish
Timeframe : Openning
Here is a more detailed summary of the historical variations registered by USD/TRY:
New HIGH record (5 years)
Type : Bullish
Timeframe : Weekly
New HIGH record (1 year)
Type : Bullish
Timeframe : Weekly
New HIGH record (1st january)
Type : Bullish
Timeframe : Weekly
New HIGH record (1 month)
Type : Bullish
Timeframe : Weekly
Abnormal volumes on USD/TRY were detected by the Central Volumes scanner:
Abnormal volumes
Timeframe : 5 days
Abnormal volumes
Timeframe : 20 days
Technical
Technical analysis of this 1H chart of USD/TRY indicates that the overall trend is strongly bullish. 85.71% of the signals given by moving averages are bullish. The slightly bullish signals given by the short-term moving averages show a weakening of the global trend. An assessment of moving averages reveals a bearish signal that could impact this trend:
Bearish trend reversal : Moving Average 20
Type : Bearish
Timeframe : 1 hour
The technical indicators are generally neutral. They do not provide relevant information on the direction of future price movements.
But beware of excesses. The Central Indicators scanner currently detects this:
CCI indicator is oversold : under -100
Type : Neutral
Timeframe : 1 hour
Pivot points : price is over resistance 3
Type : Neutral
Timeframe : Weekly
RSI indicator is back under 50
Type : Bearish
Timeframe : 1 hour
SuperTrend indicator bearish reversal
Type : Bearish
Timeframe : 1 hour
Williams %R indicator is back under -50
Type : Bearish
Timeframe : 1 hour
Central Patterns, the market scanner focusing on chart patterns, resistances and supports found these results:
Near horizontal support
Type : Bullish
Timeframe : 1 hour
Near support of channel
Type : Bullish
Timeframe : 1 hour
The Central Candlesticks scanner which studies Japanese candlesticks did not detect anything.
| S3 | S2 | S1 | Price | |
|---|---|---|---|---|
| ProTrendLines | 31.7638 | 31.9187 | 31.9841 | 32.0193 |
| Change (%) | -0.80% | -0.31% | -0.11% | - |
| Change | -0.2555 | -0.1006 | -0.0352 | - |
| Level | Intermediate | Intermediate | Minor | - |
Attention could also be paid to pivot points to set price objectives:
| Pivot points | S3 | S2 | S1 | PP | R1 | R2 | R3 |
|---|---|---|---|---|---|---|---|
| Standard | 31.6894 | 31.7638 | 31.8352 | 31.9096 | 31.9810 | 32.0554 | 32.1268 |
| Camarilla | 31.8664 | 31.8798 | 31.8931 | 31.9065 | 31.9199 | 31.9332 | 31.9466 |
| Woodie | 31.6878 | 31.7631 | 31.8336 | 31.9089 | 31.9794 | 32.0547 | 32.1252 |
| Fibonacci | 31.7638 | 31.8195 | 31.8539 | 31.9096 | 31.9653 | 31.9997 | 32.0554 |
| Pivot points | S3 | S2 | S1 | PP | R1 | R2 | R3 |
|---|---|---|---|---|---|---|---|
| Standard | 30.8779 | 31.1146 | 31.5106 | 31.7473 | 32.1433 | 32.3800 | 32.7760 |
| Camarilla | 31.7325 | 31.7905 | 31.8485 | 31.9065 | 31.9645 | 32.0225 | 32.0805 |
| Woodie | 30.9575 | 31.1544 | 31.5902 | 31.7871 | 32.2229 | 32.4198 | 32.8556 |
| Fibonacci | 31.1146 | 31.3563 | 31.5056 | 31.7473 | 31.9890 | 32.1383 | 32.3800 |
| Pivot points | S3 | S2 | S1 | PP | R1 | R2 | R3 |
|---|---|---|---|---|---|---|---|
| Standard | 29.3944 | 29.8054 | 30.5500 | 30.9610 | 31.7056 | 32.1166 | 32.8612 |
| Camarilla | 30.9769 | 31.0828 | 31.1888 | 31.2947 | 31.4006 | 31.5066 | 31.6125 |
| Woodie | 29.5613 | 29.8888 | 30.7169 | 31.0444 | 31.8725 | 32.2000 | 33.0281 |
| Fibonacci | 29.8054 | 30.2468 | 30.5195 | 30.9610 | 31.4024 | 31.6751 | 32.1166 |
Numerical data
The following is the status of the technical indicators and moving averages at the time of publication of this technical analysis:
| RSI (14): | 42.99 | |
| MACD (12,26,9): | 0.0130 | |
| Directional Movement: | -26.5786 | |
| AROON (14): | -14.2857 | |
| DEMA (21): | 31.9559 | |
| Parabolic SAR (0,02-0,02-0,2): | 31.9651 | |
| Elder Ray (13): | -0.0235 | |
| Super Trend (3,10): | 31.9853 | |
| Zig ZAG (10): | 31.9065 | |
| VORTEX (21): | 0.9102 | |
| Stochastique (14,3,5): | 60.20 | |
| TEMA (21): | 31.9384 | |
| Williams %R (14): | -53.22 | |
| Chande Momentum Oscillator (20): | -0.0458 | |
| Repulse (5,40,3): | -0.0720 | |
| ROCnROLL: | -1 | |
| TRIX (15,9): | 0.0108 | |
| Courbe Coppock: | 0.10 |
| MA7: | 31.6528 | |
| MA20: | 31.1801 | |
| MA50: | 30.5898 | |
| MA100: | 29.6585 | |
| MAexp7: | 31.9324 | |
| MAexp20: | 31.9324 | |
| MAexp50: | 31.8777 | |
| MAexp100: | 31.7687 | |
| Price / MA7: | +1.16% | |
| Price / MA20: | +2.69% | |
| Price / MA50: | +4.67% | |
| Price / MA100: | +7.96% | |
| Price / MAexp7: | +0.27% | |
| Price / MAexp20: | +0.27% | |
| Price / MAexp50: | +0.44% | |
| Price / MAexp100: | +0.79% |
News
Don't forget to follow the news on USD/TRY. At the time of publication of this analysis, the latest news was as follows:
-
 XTB Market Updates on USDTRY - 06/06/2023
-
Upside Potential For USD/TRY
-
Upside Potential For USD/TRY
-
USD/TRY
-
USD/TRY Outlook And Drivers
About author
Online


Add a comment
Comments
0 comments on the analysis USD/TRY - 1H