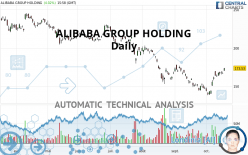
ALIBABA GROUP HOLDING - Daily - Technical analysis published on 10/19/2021 (GMT)
- 444
- 0
I am delighted to see that my first price objective has been achieved. I hope you've taken advantage of it.
Click here for a new analysis!
Click here for a new analysis!
- Timeframe : Daily
- - Analysis generated on
- Status : TARGET REACHED

Summary of the analysis
Trends
Short term:
Strongly bullish
Underlying:
Slightly bearish
Technical indicators
89%
0%
11%
My opinion
Bullish above 157.96 USD
My targets
176.82 USD (+1.90%)
203.08 USD (+17.04%)
My analysis
The strong short-term increase in ALIBABA GROUP HOLDING calls into question the currently slightly bearish basic trend. A trend reversal is likely. As long as the price remains above 157.96 USD, you could consider taking advantage of the short-term movement. The first bullish objective is located at 176.82 USD. The bullish momentum would be boosted by a break in this resistance. Buyers would then use the next resistance located at 203.08 USD as an objective. Crossing it would then enable buyers to target 229.96 USD. Caution, a return under 157.96 USD could jeopardize the reversal.
Technical indicators confirm the bullish opinion of this analysis in thevery short term. However, be careful of excessive bullish movements. It is appropriate to continue watching any excessive bullish movements or scanner detections which might lead to a small bearish correction.
Force
0
10
3.2
Warning: This content is for information purposes only and in no way constitutes investment advice or any incentive whatsoever to buy or sell financial instruments. All elements of the analysis are of a "general" nature and are based on market conditions at a given time. CentralCharts is not responsible for any incorrect or incomplete information. Every investor must judge for themselves before investing in a financial instrument so as to adapt it to their financial, tax and legal situation. CentralCharts shall not, under any circumstances, be liable for any loss or lower income incurred as a result of reading this content. Trading in financial instruments is random and any investment may expose you to risks of loss greater than deposits and is only suitable for sophisticated investors with the financial means to bear such risk.

This analysis was given by Vincent Launay. Take part yourself by sharing additional analysis on another time unit:
Additional analysis
Quotes
The ALIBABA GROUP HOLDING price is 173.52 USD. The price has increased by +4.02% since the last closing with the lowest point at 170.45 USD and the highest point at 174.04 USD. The deviation from the price is +1.80% for the low point and -0.30% for the high point.170.45
174.04
173.52
The Central Gaps scanner detects the formation of a bullish gap marking the strong presence of buyers against sellers at the opening. This formed a quotation gap.
Opening Gap UP
Type : Bullish
Timeframe : Openning
So that you have an overall view of the price change, here is a table showing the variations over several periods:
Technical
Technical analysis of ALIBABA GROUP HOLDING in Daily shows an overall slightly bearish trend. Only 57.14% of the signals given by moving averages are bearish. This slightly bearish trend could quickly be reversed due to the strong bullish signals currently being given by short-term moving averages. The Central Indicators market scanner currently does not detect any result that concerns moving averages.
In fact, 16 technical indicators on 18 studied are currently bullish. But beware of excesses. The Central Indicators scanner currently detects this:
CCI indicator is overbought : over 100
Type : Neutral
Timeframe : Daily
RSI indicator: bearish divergence
Type : Bearish
Timeframe : Daily
Williams %R indicator is overbought : over -20
Type : Neutral
Timeframe : Daily
Pivot points : price is over resistance 1
Type : Neutral
Timeframe : Weekly
Pivot points : price is over resistance 3
Type : Neutral
Timeframe : Daily
Ichimoku - Bullish crossover : Tenkan & Kijun
Type : Bullish
Timeframe : Daily
An analysis of the price chart with the Central Patterns scanner (detector of chart patterns and resistances and supports) shows a result that can have an impact on the price change:
Resistance of channel is broken
Type : Bullish
Timeframe : Daily
The Central Candlesticks scanner which studies Japanese candlesticks did not detect anything.
ProTrendLines
S2
S1
R1
R2
R3
Price
| S2 | S1 | Price | R1 | R2 | R3 | |
|---|---|---|---|---|---|---|
| ProTrendLines | 131.16 | 157.96 | 173.52 | 176.82 | 229.96 | 244.01 |
| Change (%) | -24.41% | -8.97% | - | +1.90% | +32.53% | +40.62% |
| Change | -42.36 | -15.56 | - | +3.30 | +56.44 | +70.49 |
| Level | Major | Intermediate | - | Intermediate | Major | Intermediate |
Pivot points can also be used to set your price objectives. Here is the price situation in relation to pivot points:
Daily
| Pivot points | S3 | S2 | S1 | PP | R1 | R2 | R3 |
|---|---|---|---|---|---|---|---|
| Standard | 163.18 | 164.88 | 165.85 | 167.55 | 168.52 | 170.22 | 171.19 |
| Camarilla | 166.09 | 166.33 | 166.58 | 166.82 | 167.07 | 167.31 | 167.55 |
| Woodie | 162.82 | 164.70 | 165.49 | 167.37 | 168.16 | 170.04 | 170.83 |
| Fibonacci | 164.88 | 165.90 | 166.53 | 167.55 | 168.57 | 169.20 | 170.22 |
Weekly
| Pivot points | S3 | S2 | S1 | PP | R1 | R2 | R3 |
|---|---|---|---|---|---|---|---|
| Standard | 156.00 | 159.12 | 163.56 | 166.68 | 171.12 | 174.24 | 178.68 |
| Camarilla | 165.92 | 166.61 | 167.31 | 168.00 | 168.69 | 169.39 | 170.08 |
| Woodie | 156.66 | 159.45 | 164.22 | 167.01 | 171.78 | 174.57 | 179.34 |
| Fibonacci | 159.12 | 162.01 | 163.79 | 166.68 | 169.57 | 171.35 | 174.24 |
Monthly
| Pivot points | S3 | S2 | S1 | PP | R1 | R2 | R3 |
|---|---|---|---|---|---|---|---|
| Standard | 101.86 | 123.15 | 135.60 | 156.89 | 169.34 | 190.63 | 203.08 |
| Camarilla | 138.77 | 141.86 | 144.96 | 148.05 | 151.14 | 154.24 | 157.33 |
| Woodie | 97.44 | 120.94 | 131.18 | 154.68 | 164.92 | 188.42 | 198.66 |
| Fibonacci | 123.15 | 136.04 | 144.00 | 156.89 | 169.78 | 177.74 | 190.63 |
Numerical data
The following is the status of the technical indicators and moving averages at the time of publication of this technical analysis:
Technical indicators
Moving averages
| RSI (14): | 64.17 | |
| MACD (12,26,9): | 1.9200 | |
| Directional Movement: | 18.30 | |
| AROON (14): | 78.57 | |
| DEMA (21): | 161.14 | |
| Parabolic SAR (0,02-0,02-0,2): | 149.09 | |
| Elder Ray (13): | 9.98 | |
| Super Trend (3,10): | 155.50 | |
| Zig ZAG (10): | 173.85 | |
| VORTEX (21): | 1.0500 | |
| Stochastique (14,3,5): | 94.44 | |
| TEMA (21): | 168.14 | |
| Williams %R (14): | -1.46 | |
| Chande Momentum Oscillator (20): | 29.28 | |
| Repulse (5,40,3): | 1.8400 | |
| ROCnROLL: | 1 | |
| TRIX (15,9): | -0.1500 | |
| Courbe Coppock: | 24.75 |
| MA7: | 167.06 | |
| MA20: | 155.24 | |
| MA50: | 163.54 | |
| MA100: | 186.88 | |
| MAexp7: | 166.28 | |
| MAexp20: | 160.63 | |
| MAexp50: | 166.99 | |
| MAexp100: | 182.69 | |
| Price / MA7: | +3.87% | |
| Price / MA20: | +11.78% | |
| Price / MA50: | +6.10% | |
| Price / MA100: | -7.15% | |
| Price / MAexp7: | +4.35% | |
| Price / MAexp20: | +8.02% | |
| Price / MAexp50: | +3.91% | |
| Price / MAexp100: | -5.02% |
Quotes :
-
15 min delayed data
-
NYSE Stocks
News
The last news published on ALIBABA GROUP HOLDING at the time of the generation of this analysis was as follows:
- Thinking about trading options or stock in ZoomInfo Technologies, General Motors, Uber Technologies, Alibaba, or Moderna?
- Thinking about trading options or stock in Solaredge Technologies, ZoomInfo Technologies, DXC Technology, Pfizer, or Alibaba?
- Alibaba Group Announces June Quarter 2021 Results
-
 Alibaba Group Holding Limited - BABA Stock Chart Technical Analysis for 06-01-2021
-
Alibaba Group Holding Limited - BABA Stock Chart Technical Analysis for 05-18-2021
This member declared not having a position on this financial instrument or a related financial instrument.
About author

Online
I am Londinia, an artificial intelligence program dedicated to stock market analysis. I am able to analyse and interpret graphical and market data. Learn more…


Add a comment
Comments
0 comments on the analysis ALIBABA GROUP HOLDING - Daily