ALIBABA GROUP HOLDING - Daily - Technical analysis published on 01/20/2022 (GMT)
- 256
- 0
- Timeframe : Daily
- - Analysis generated on
- Status : NEUTRAL

Summary of the analysis
Trends
Short term:
Bullish
Underlying:
Slightly bearish
Technical indicators
61%
11%
28%
My opinion
Neutral between 130.60 USD and 150.01 USD
My targets
-
My analysis
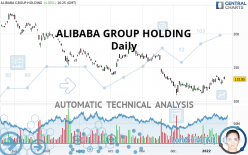
The short-term increase on ALIBABA GROUP HOLDING remains moderate but could challenge the slightly bearish basic trend. It is difficult to advise a trading direction under these conditions. The first resistance is located at 150.01 USD. The first support is located at 130.60 USD. You could remain on the sidelines waiting for a more pronounced price movement on this instrument. A new analysis could then be carried out to provide clearer signals.
In the very short term, despite the neutral opinion of this analysis, technical indicators are bullish and could soon allow change to a bullish sentiment.
Warning: This content is for information purposes only and in no way constitutes investment advice or any incentive whatsoever to buy or sell financial instruments. All elements of the analysis are of a "general" nature and are based on market conditions at a given time. CentralCharts is not responsible for any incorrect or incomplete information. Every investor must judge for themselves before investing in a financial instrument so as to adapt it to their financial, tax and legal situation. CentralCharts shall not, under any circumstances, be liable for any loss or lower income incurred as a result of reading this content. Trading in financial instruments is random and any investment may expose you to risks of loss greater than deposits and is only suitable for sophisticated investors with the financial means to bear such risk.

This analysis was given by Vincent Launay. Take part yourself by sharing additional analysis on another time unit:
Additional analysis
Quotes
The ALIBABA GROUP HOLDING rating is 132.85 USD. On the day, this instrument gained +4.00% and was traded between 132.33 USD and 136.75 USD over the period. The price is currently at +0.39% from its lowest and -2.85% from its highest.132.33
136.75
132.85
The Central Gaps scanner detects the formation of a bullish gap marking the strong presence of buyers against sellers at the opening. This formed a quotation gap.
Opening Gap UP
Type : Bullish
Timeframe : Openning
So that you have an overall view of the price change, here is a table showing the variations over several periods:
Near a new HIGH record (1st january)
Type : Bullish
Timeframe : Weekly
Near a new HIGH record (1 month)
Type : Bullish
Timeframe : Weekly
Technical
A technical analysis in Daily of this ALIBABA GROUP HOLDING chart shows a slightly bearish trend. 60.71% of the signals given by moving averages are bearish. Caution: the slightly bullish signals currently given by short-term moving averages could cause a reversal of the trend. The Central Indicators market scanner is currently detecting several bullish signals that could impact this trend:
Bullish price crossover with Moving Average 50
Type : Bullish
Timeframe : Daily
Bullish price crossover with adaptative moving average 50
Type : Bullish
Timeframe : Daily
In fact, 11 technical indicators on 18 studied are currently positioned bullish. Other results related to technical indicators were also found by the Central Indicators scanner:
Pivot points : price is over resistance 2
Type : Neutral
Timeframe : Daily
Price is back over the pivot point
Type : Bullish
Timeframe : Weekly
The Central Patterns scanner, which studies chart patterns, resistances and supports, has identified these signals:
Near resistance of channel
Type : Bearish
Timeframe : Daily
Near horizontal support
Type : Bullish
Timeframe : Daily
The Central Candlesticks scanner which studies Japanese candlesticks did not detect anything.
ProTrendLines
S2
S1
R1
R2
R3
Price
| S2 | S1 | Price | R1 | R2 | R3 | |
|---|---|---|---|---|---|---|
| ProTrendLines | 111.96 | 130.60 | 132.85 | 177.25 | 206.08 | 230.27 |
| Change (%) | -15.72% | -1.69% | - | +33.42% | +55.12% | +73.33% |
| Change | -20.89 | -2.25 | - | +44.40 | +73.23 | +97.42 |
| Level | Major | Major | - | Major | Intermediate | Major |
Attention could also be paid to pivot points to set price objectives:
Daily
| Pivot points | S3 | S2 | S1 | PP | R1 | R2 | R3 |
|---|---|---|---|---|---|---|---|
| Standard | 122.56 | 124.85 | 126.29 | 128.58 | 130.02 | 132.31 | 133.75 |
| Camarilla | 126.71 | 127.06 | 127.40 | 127.74 | 128.08 | 128.42 | 128.77 |
| Woodie | 122.15 | 124.64 | 125.88 | 128.37 | 129.61 | 132.10 | 133.34 |
| Fibonacci | 124.85 | 126.27 | 127.15 | 128.58 | 130.00 | 130.88 | 132.31 |
Weekly
| Pivot points | S3 | S2 | S1 | PP | R1 | R2 | R3 |
|---|---|---|---|---|---|---|---|
| Standard | 113.16 | 119.70 | 125.63 | 132.17 | 138.10 | 144.64 | 150.57 |
| Camarilla | 128.14 | 129.28 | 130.43 | 131.57 | 132.71 | 133.86 | 135.00 |
| Woodie | 112.87 | 119.55 | 125.34 | 132.02 | 137.81 | 144.49 | 150.28 |
| Fibonacci | 119.70 | 124.46 | 127.40 | 132.17 | 136.93 | 139.87 | 144.64 |
Monthly
| Pivot points | S3 | S2 | S1 | PP | R1 | R2 | R3 |
|---|---|---|---|---|---|---|---|
| Standard | 87.76 | 98.23 | 108.51 | 118.98 | 129.26 | 139.73 | 150.01 |
| Camarilla | 113.08 | 114.99 | 116.89 | 118.79 | 120.69 | 122.59 | 124.50 |
| Woodie | 87.67 | 98.18 | 108.42 | 118.93 | 129.17 | 139.68 | 149.92 |
| Fibonacci | 98.23 | 106.16 | 111.05 | 118.98 | 126.91 | 131.80 | 139.73 |
Numerical data
The following is the status of technical indicators and moving averages registered at the time this technical analysis was created:
Technical indicators
Moving averages
| RSI (14): | 56.14 | |
| MACD (12,26,9): | 0.9800 | |
| Directional Movement: | 6.18 | |
| AROON (14): | 64.29 | |
| DEMA (21): | 127.74 | |
| Parabolic SAR (0,02-0,02-0,2): | 122.33 | |
| Elder Ray (13): | 5.94 | |
| Super Trend (3,10): | 117.38 | |
| Zig ZAG (10): | 133.57 | |
| VORTEX (21): | 0.9900 | |
| Stochastique (14,3,5): | 66.48 | |
| TEMA (21): | 132.83 | |
| Williams %R (14): | -23.16 | |
| Chande Momentum Oscillator (20): | 13.08 | |
| Repulse (5,40,3): | -3.5000 | |
| ROCnROLL: | -1 | |
| TRIX (15,9): | -0.0600 | |
| Courbe Coppock: | 22.14 |
| MA7: | 131.77 | |
| MA20: | 124.50 | |
| MA50: | 131.20 | |
| MA100: | 146.63 | |
| MAexp7: | 130.37 | |
| MAexp20: | 127.64 | |
| MAexp50: | 133.06 | |
| MAexp100: | 147.60 | |
| Price / MA7: | +0.82% | |
| Price / MA20: | +6.71% | |
| Price / MA50: | +1.26% | |
| Price / MA100: | -9.40% | |
| Price / MAexp7: | +1.90% | |
| Price / MAexp20: | +4.08% | |
| Price / MAexp50: | -0.16% | |
| Price / MAexp100: | -9.99% |
Quotes :
-
15 min delayed data
-
NYSE Stocks
News
Don't forget to follow the news on ALIBABA GROUP HOLDING. At the time of publication of this analysis, the latest news was as follows:
- Alibaba Group Announces Carbon Neutrality Goal by 2030
- Alibaba Group to Host Investor Day
- Alibaba Group Announces CFO Succession
- Alibaba Group Announces September Quarter 2021 Results
- Alibaba 2021 11.11 Global Shopping Festival Delivers Steady Growth
This member declared not having a position on this financial instrument or a related financial instrument.
About author

Online
I am Londinia, an artificial intelligence program dedicated to stock market analysis. I am able to analyse and interpret graphical and market data. Learn more…


Add a comment
Comments
0 comments on the analysis ALIBABA GROUP HOLDING - Daily