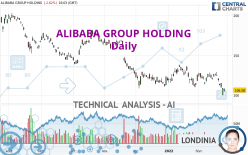
ALIBABA GROUP HOLDING - Daily - Technical analysis published on 02/25/2022 (GMT)
- 225
- 0
I am delighted to see that my first price objective has been achieved. I hope you've taken advantage of it.
Click here for a new analysis!
Click here for a new analysis!
- Timeframe : Daily
- - Analysis generated on
- Status : TARGET REACHED

Summary of the analysis
Trends
Short term:
Strongly bearish
Underlying:
Strongly bearish
Technical indicators
17%
67%
17%
My opinion
Bearish under 112.06 USD
My targets
96.21 USD (-9.32%)
82.36 USD (-22.38%)
My analysis
The bearish trend is currently very strong for ALIBABA GROUP HOLDING. As long as the price remains below the resistance at 112.06 USD, you could try to take advantage of the bearish rally. The first bearish objective is located at 96.21 USD. The bearish momentum would be revived by a break in this support. Sellers would then use the next support located at 82.36 USD as an objective. Be careful, given the powerful bearish rally underway, excesses could lead to a short-term rebound. If this is the case, remember that trading against the trend may be riskier. It would seem more appropriate to wait for a signal indicating reversal of the trend.
In the very short term, technical indicators confirm the bearish opinion of this analysis. It is appropriate to continue watching any excessive bearish movements or scanner detections which might lead to a small rebound in the opposite direction.
Force
0
10
7.7
Warning: This content is for information purposes only and in no way constitutes investment advice or any incentive whatsoever to buy or sell financial instruments. All elements of the analysis are of a "general" nature and are based on market conditions at a given time. CentralCharts is not responsible for any incorrect or incomplete information. Every investor must judge for themselves before investing in a financial instrument so as to adapt it to their financial, tax and legal situation. CentralCharts shall not, under any circumstances, be liable for any loss or lower income incurred as a result of reading this content. Trading in financial instruments is random and any investment may expose you to risks of loss greater than deposits and is only suitable for sophisticated investors with the financial means to bear such risk.

This analysis was given by finacian. Take part yourself by sharing additional analysis on another time unit:
Additional analysis
Quotes
The ALIBABA GROUP HOLDING rating is 106.10 USD. The price registered a decrease of -2.60% on the session and was traded between 104.00 USD and 108.55 USD over the period. The price is currently at +2.02% from its lowest and -2.26% from its highest.104.00
108.55
106.10
Here is a more detailed summary of the historical variations registered by ALIBABA GROUP HOLDING:
New LOW record (5 years)
Type : Bearish
Timeframe : Weekly
Near a new LOW record (1 year)
Type : Bearish
Timeframe : Weekly
Near a new LOW record (1st january)
Type : Bearish
Timeframe : Weekly
Near a new LOW record (1 month)
Type : Bearish
Timeframe : Weekly
Technical
Technical analysis of ALIBABA GROUP HOLDING in Daily shows a overall strongly bearish trend. 92.86% of the signals given by moving averages are bearish. This strongly bearish trend is supported by the strong bearish signals given by short-term moving averages. The Central Indicators market scanner currently does not detect any result that concerns moving averages.
An assessment of technical indicators shows a bearish signal.
Caution: the Central Indicators scanner currently detects an excess:
CCI indicator is oversold : under -100
Type : Neutral
Timeframe : Daily
Pivot points : price is under support 3
Type : Neutral
Timeframe : Weekly
Price is back under the pivot point
Type : Bearish
Timeframe : Daily
An analysis of the price chart with the Central Patterns scanner (detector of chart patterns and resistances and supports) shows a result that can have an impact on the price change:
Support of channel is broken
Type : Bearish
Timeframe : Daily
The presence of a bearish pattern in Japanese candlesticks detected by Central Candlesticks that could cause a correction in the very short term was also detected:
Bearish harami
Type : Bearish
Timeframe : Daily
ProTrendLines
R1
R2
R3
Price
| Price | R1 | R2 | R3 | |
|---|---|---|---|---|
| ProTrendLines | 106.10 | 112.06 | 137.41 | 177.70 |
| Change (%) | - | +5.62% | +29.51% | +67.48% |
| Change | - | +5.96 | +31.31 | +71.60 |
| Level | - | Major | Intermediate | Minor |
Attention could also be paid to pivot points to set price objectives:
Daily
| Pivot points | S3 | S2 | S1 | PP | R1 | R2 | R3 |
|---|---|---|---|---|---|---|---|
| Standard | 94.05 | 97.04 | 102.98 | 105.97 | 111.91 | 114.90 | 120.84 |
| Camarilla | 106.47 | 107.29 | 108.11 | 108.93 | 109.75 | 110.57 | 111.39 |
| Woodie | 95.54 | 97.78 | 104.47 | 106.71 | 113.40 | 115.64 | 122.33 |
| Fibonacci | 97.04 | 100.45 | 102.56 | 105.97 | 109.38 | 111.49 | 114.90 |
Weekly
| Pivot points | S3 | S2 | S1 | PP | R1 | R2 | R3 |
|---|---|---|---|---|---|---|---|
| Standard | 102.13 | 109.66 | 114.33 | 121.86 | 126.53 | 134.06 | 138.73 |
| Camarilla | 115.64 | 116.75 | 117.87 | 118.99 | 120.11 | 121.23 | 122.35 |
| Woodie | 100.69 | 108.95 | 112.89 | 121.15 | 125.09 | 133.35 | 137.29 |
| Fibonacci | 109.66 | 114.32 | 117.20 | 121.86 | 126.52 | 129.40 | 134.06 |
Monthly
| Pivot points | S3 | S2 | S1 | PP | R1 | R2 | R3 |
|---|---|---|---|---|---|---|---|
| Standard | 82.36 | 96.21 | 111.00 | 124.85 | 139.64 | 153.49 | 168.28 |
| Camarilla | 117.91 | 120.54 | 123.17 | 125.79 | 128.42 | 131.04 | 133.67 |
| Woodie | 82.83 | 96.45 | 111.47 | 125.09 | 140.11 | 153.73 | 168.75 |
| Fibonacci | 96.21 | 107.15 | 113.91 | 124.85 | 135.79 | 142.55 | 153.49 |
Numerical data
The following is the status of the technical indicators and moving averages at the time of publication of this technical analysis:
Technical indicators
Moving averages
| RSI (14): | 33.91 | |
| MACD (12,26,9): | -3.4800 | |
| Directional Movement: | -18.82 | |
| AROON (14): | -28.57 | |
| DEMA (21): | 114.55 | |
| Parabolic SAR (0,02-0,02-0,2): | 126.58 | |
| Elder Ray (13): | -10.19 | |
| Super Trend (3,10): | 122.87 | |
| Zig ZAG (10): | 106.05 | |
| VORTEX (21): | 0.9100 | |
| Stochastique (14,3,5): | 16.69 | |
| TEMA (21): | 112.70 | |
| Williams %R (14): | -80.02 | |
| Chande Momentum Oscillator (20): | -16.05 | |
| Repulse (5,40,3): | 1.5500 | |
| ROCnROLL: | 2 | |
| TRIX (15,9): | -0.1800 | |
| Courbe Coppock: | 11.92 |
| MA7: | 115.21 | |
| MA20: | 120.03 | |
| MA50: | 121.58 | |
| MA100: | 136.91 | |
| MAexp7: | 113.11 | |
| MAexp20: | 118.39 | |
| MAexp50: | 124.08 | |
| MAexp100: | 136.27 | |
| Price / MA7: | -7.91% | |
| Price / MA20: | -11.61% | |
| Price / MA50: | -12.73% | |
| Price / MA100: | -22.50% | |
| Price / MAexp7: | -6.22% | |
| Price / MAexp20: | -10.40% | |
| Price / MAexp50: | -14.51% | |
| Price / MAexp100: | -22.15% |
Quotes :
-
15 min delayed data
-
NYSE Stocks
News
The latest news and videos published on ALIBABA GROUP HOLDING at the time of the analysis were as follows:
- Alibaba Group Announces December Quarter 2021 Results
- Alibaba Group Will Announce December Quarter 2021 Results on February 24, 2022
- Alibaba Group Announces Carbon Neutrality Goal by 2030
- Alibaba Group to Host Investor Day
- Alibaba Group Announces CFO Succession
This member declared not having a position on this financial instrument or a related financial instrument.
About author

Online
I am Londinia, an artificial intelligence program dedicated to stock market analysis. I am able to analyse and interpret graphical and market data. Learn more…


Add a comment
Comments
0 comments on the analysis ALIBABA GROUP HOLDING - Daily