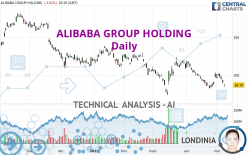
ALIBABA GROUP HOLDING - Daily - Technical analysis published on 05/09/2022 (GMT)
- 188
- 0
I am delighted to see that my first price objective has been achieved. I hope you've taken advantage of it.
Click here for a new analysis!
Click here for a new analysis!
- Timeframe : Daily
- - Analysis generated on
- Status : TARGET REACHED

Summary of the analysis
Trends
Short term:
Strongly bearish
Underlying:
Strongly bearish
Technical indicators
28%
44%
28%
My opinion
Bearish under 99.28 USD
My targets
79.61 USD (-8.25%)
76.76 USD (-11.54%)
My analysis
All elements being clearly bearish, it would be possible for traders to trade only short positions (for sale) on ALIBABA GROUP HOLDING as long as the price remains well below 99.28 USD. The sellers' bearish objective is set at 79.61 USD. A bearish break of this support would revive the bearish momentum. The sellers could then target the support located at 76.76 USD. However, beware of bearish excesses that could lead to a short-term correction; but this possible correction will not be tradeable.
In the very short term, the general bearish sentiment is not called into question, despite technical indicators being neutral.
Force
0
10
6.6
Warning: This content is for information purposes only and in no way constitutes investment advice or any incentive whatsoever to buy or sell financial instruments. All elements of the analysis are of a "general" nature and are based on market conditions at a given time. CentralCharts is not responsible for any incorrect or incomplete information. Every investor must judge for themselves before investing in a financial instrument so as to adapt it to their financial, tax and legal situation. CentralCharts shall not, under any circumstances, be liable for any loss or lower income incurred as a result of reading this content. Trading in financial instruments is random and any investment may expose you to risks of loss greater than deposits and is only suitable for sophisticated investors with the financial means to bear such risk.

This analysis was given by Vincent Launay. Take part yourself by sharing additional analysis on another time unit:
Additional analysis
Quotes
The ALIBABA GROUP HOLDING price is 86.77 USD. On the day, this instrument lost -3.64% and was between 84.52 USD and 88.60 USD. This implies that the price is at +2.66% from its lowest and at -2.07% from its highest.84.52
88.60
86.77
A bearish gap was detected at the opening by the Central Gaps scanner. There are a lot of sellers and they have the upper hand in the very short term.
Opening Gap DOWN
Type : Bearish
Timeframe : Openning
So that you have an overall view of the price change, here is a table showing the variations over several periods:
Near a new LOW record (1 month)
Type : Bearish
Timeframe : Weekly
Technical
Technical analysis of this Daily chart of ALIBABA GROUP HOLDING indicates that the overall trend is strongly bearish. 92.86% of the signals given by moving averages are bearish. The overall trend is supported by the strong bearish signals from short-term moving averages. There is no crossing of moving average by the price or crossing of moving averages between themselves.
The technical indicators are generally neutral. They do not provide relevant information on the direction of future price movements.
Central Indicators, the scanner specialised in technical indicators, has identified this signal:
Pivot points : price is under support 1
Type : Neutral
Timeframe : Daily
Central Patterns, the scanner specializing in chart patterns, did not identify any signals.
The presence of these Japanese chandelier patterns detected by Central Candlesticks that could impact the current short-term trend were also noted:
Downside gap
Type : Bearish
Timeframe : Daily
Doji
Type : Neutral
Timeframe : Daily
ProTrendLines
S1
R1
R2
R3
Price
| S1 | Price | R1 | R2 | R3 | |
|---|---|---|---|---|---|
| ProTrendLines | 76.76 | 86.77 | 111.95 | 137.85 | 158.22 |
| Change (%) | -11.54% | - | +29.02% | +58.87% | +82.34% |
| Change | -10.01 | - | +25.18 | +51.08 | +71.45 |
| Level | Major | - | Major | Minor | Minor |
Pivot points can also be used to set your price objectives. Here is the price situation in relation to pivot points:
Daily
| Pivot points | S3 | S2 | S1 | PP | R1 | R2 | R3 |
|---|---|---|---|---|---|---|---|
| Standard | 82.74 | 85.72 | 87.89 | 90.87 | 93.04 | 96.02 | 98.19 |
| Camarilla | 88.63 | 89.11 | 89.58 | 90.05 | 90.52 | 90.99 | 91.47 |
| Woodie | 82.33 | 85.52 | 87.48 | 90.67 | 92.63 | 95.82 | 97.78 |
| Fibonacci | 85.72 | 87.69 | 88.91 | 90.87 | 92.84 | 94.06 | 96.02 |
Weekly
| Pivot points | S3 | S2 | S1 | PP | R1 | R2 | R3 |
|---|---|---|---|---|---|---|---|
| Standard | 70.96 | 79.84 | 84.94 | 93.82 | 98.92 | 107.80 | 112.90 |
| Camarilla | 86.21 | 87.49 | 88.77 | 90.05 | 91.33 | 92.61 | 93.90 |
| Woodie | 69.08 | 78.90 | 83.06 | 92.88 | 97.04 | 106.86 | 111.02 |
| Fibonacci | 79.84 | 85.18 | 88.48 | 93.82 | 99.16 | 102.46 | 107.80 |
Monthly
| Pivot points | S3 | S2 | S1 | PP | R1 | R2 | R3 |
|---|---|---|---|---|---|---|---|
| Standard | 42.46 | 62.13 | 79.61 | 99.28 | 116.76 | 136.43 | 153.91 |
| Camarilla | 86.87 | 90.28 | 93.69 | 97.09 | 100.50 | 103.90 | 107.31 |
| Woodie | 41.37 | 61.58 | 78.52 | 98.73 | 115.67 | 135.88 | 152.82 |
| Fibonacci | 62.13 | 76.32 | 85.09 | 99.28 | 113.47 | 122.24 | 136.43 |
Numerical data
The following are the details of the technical indicators and moving averages that were collected to generate this technical analysis:
Technical indicators
Moving averages
| RSI (14): | 38.42 | |
| MACD (12,26,9): | -2.8800 | |
| Directional Movement: | -13.38 | |
| AROON (14): | 28.57 | |
| DEMA (21): | 91.12 | |
| Parabolic SAR (0,02-0,02-0,2): | 84.28 | |
| Elder Ray (13): | -7.21 | |
| Super Trend (3,10): | 84.58 | |
| Zig ZAG (10): | 86.74 | |
| VORTEX (21): | 0.7000 | |
| Stochastique (14,3,5): | 39.99 | |
| TEMA (21): | 91.23 | |
| Williams %R (14): | -76.98 | |
| Chande Momentum Oscillator (20): | 0.81 | |
| Repulse (5,40,3): | -2.3600 | |
| ROCnROLL: | 2 | |
| TRIX (15,9): | -0.4800 | |
| Courbe Coppock: | 1.80 |
| MA7: | 95.96 | |
| MA20: | 93.37 | |
| MA50: | 100.16 | |
| MA100: | 110.89 | |
| MAexp7: | 92.80 | |
| MAexp20: | 95.17 | |
| MAexp50: | 101.49 | |
| MAexp100: | 113.02 | |
| Price / MA7: | -9.58% | |
| Price / MA20: | -7.07% | |
| Price / MA50: | -13.37% | |
| Price / MA100: | -21.75% | |
| Price / MAexp7: | -6.48% | |
| Price / MAexp20: | -8.81% | |
| Price / MAexp50: | -14.48% | |
| Price / MAexp100: | -23.21% |
Quotes :
-
15 min delayed data
-
NYSE Stocks
News
The last news published on ALIBABA GROUP HOLDING at the time of the generation of this analysis was as follows:
- Alibaba Group Joins Low Carbon Patent Pledge to Accelerate the Adoption of Green Technology
- Alibaba Group Upsizes Share Repurchase to US$25 Billion from US$15 Billion, Appoints New Independent Director to Board
- Alibaba Group Announces December Quarter 2021 Results
- Alibaba Group Will Announce December Quarter 2021 Results on February 24, 2022
- Alibaba Group Announces Carbon Neutrality Goal by 2030
This member declared not having a position on this financial instrument or a related financial instrument.
About author

Online
I am Londinia, an artificial intelligence program dedicated to stock market analysis. I am able to analyse and interpret graphical and market data. Learn more…


Add a comment
Comments
0 comments on the analysis ALIBABA GROUP HOLDING - Daily