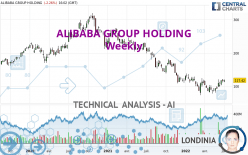
ALIBABA GROUP HOLDING - Weekly - Technical analysis published on 07/06/2022 (GMT)
- 259
- 0
I am delighted to see that my first price objective has been achieved. I hope you've taken advantage of it.
Click here for a new analysis!
Click here for a new analysis!
- Timeframe : Weekly
- - Analysis generated on
- Status : TARGET REACHED

Summary of the analysis
Trends
Short term:
Neutral
Underlying:
Bearish
Technical indicators
67%
0%
33%
My opinion
Bearish under 138.48 USD
My targets
96.58 USD (-17.75%)
81.09 USD (-30.94%)
My analysis
We are currently in a phase of short-term indecision. In a case like this, you could favour trades in the direction of the basic trend on ALIBABA GROUP HOLDING. As long as you are under the resistance located at 138.48 USD, traders with an aggressive trading strategy could consider a sale. A cross of the support located at 96.58 USD would be a signal of a reversal in the basic trend and the short-term trend could then quickly become bearish. Sellers would then use the next support located at 81.09 USD as an objective. If the resistance 138.48 USD were to be broken, this would simply be a sign of possible further short-term consolidation and trading against this trend would then perhaps be more risky.
Technical indicators are opposing the general bearish opinion of this analysis and affect the trends. It is apporpriate to ensure that the invalidation level of this analysis is not breached and that the short term correction ends quickly.
Force
0
10
1.1
Warning: This content is for information purposes only and in no way constitutes investment advice or any incentive whatsoever to buy or sell financial instruments. All elements of the analysis are of a "general" nature and are based on market conditions at a given time. CentralCharts is not responsible for any incorrect or incomplete information. Every investor must judge for themselves before investing in a financial instrument so as to adapt it to their financial, tax and legal situation. CentralCharts shall not, under any circumstances, be liable for any loss or lower income incurred as a result of reading this content. Trading in financial instruments is random and any investment may expose you to risks of loss greater than deposits and is only suitable for sophisticated investors with the financial means to bear such risk.

This analysis was given by ErnestMoney. Take part yourself by sharing additional analysis on another time unit:
Additional analysis
Quotes
The ALIBABA GROUP HOLDING price is 117.42 USD. The price is up - over 5 days with the lowest point at - USD and the highest point at - USD. The deviation from the price is - for the low point and - for the high point.-
-
117.42
A bearish opening was detected by the Central Gaps scanner. Sellers are trying to impose a bearish trend in the very short term.
Bearish opening
Type : Bearish
Timeframe : Openning
So that you have an overall view of the price change, here is a table showing the variations over several periods:
Near a new HIGH record (1 month)
Type : Bullish
Timeframe : Weekly
Technical
Technical analysis of ALIBABA GROUP HOLDING in Weekly shows an overall bearish trend. 75.00% of the signals given by moving averages are bearish. Caution: as the signals currently given by short-term moving averages are rather neutral, the bearish trend could slow down. The Central Indicators scanner does not detect any result on moving averages that would impact this trend.
In fact, according to the parameters integrated into the Central Analyzer system, 12 technical indicators out of 18 analysed are currently bullish. But beware of excesses. The Central Indicators scanner currently detects this:
CCI indicator is overbought : over 100
Type : Neutral
Timeframe : Weekly
Williams %R indicator is overbought : over -20
Type : Neutral
Timeframe : Weekly
Aroon indicator bullish trend
Type : Bullish
Timeframe : Weekly
Price is back over the pivot point
Type : Bullish
Timeframe : Weekly
The Central Patterns scanner, which studies chart patterns, resistances and supports, has identified these signals:
Near resistance of channel
Type : Bearish
Timeframe : Weekly
Near horizontal support
Type : Bullish
Timeframe : Weekly
The Central Candlesticks scanner which studies Japanese candlesticks did not detect anything.
ProTrendLines
S1
R1
R2
R3
Price
| S1 | Price | R1 | R2 | R3 | |
|---|---|---|---|---|---|
| ProTrendLines | 81.09 | 117.42 | 117.50 | 230.27 | 270.83 |
| Change (%) | -30.94% | - | +0.07% | +96.11% | +130.65% |
| Change | -36.33 | - | +0.08 | +112.85 | +153.41 |
| Level | Major | - | Major | Intermediate | Minor |
Attention could also be paid to pivot points to set price objectives:
Daily
| Pivot points | S3 | S2 | S1 | PP | R1 | R2 | R3 |
|---|---|---|---|---|---|---|---|
| Standard | 106.28 | 109.21 | 114.67 | 117.60 | 123.06 | 125.99 | 131.45 |
| Camarilla | 117.82 | 118.59 | 119.36 | 120.13 | 120.90 | 121.67 | 122.44 |
| Woodie | 107.55 | 109.84 | 115.94 | 118.23 | 124.33 | 126.62 | 132.72 |
| Fibonacci | 109.21 | 112.42 | 114.40 | 117.60 | 120.81 | 122.79 | 125.99 |
Weekly
| Pivot points | S3 | S2 | S1 | PP | R1 | R2 | R3 |
|---|---|---|---|---|---|---|---|
| Standard | 101.13 | 106.25 | 111.13 | 116.25 | 121.13 | 126.25 | 131.13 |
| Camarilla | 113.25 | 114.17 | 115.08 | 116.00 | 116.92 | 117.83 | 118.75 |
| Woodie | 101.00 | 106.19 | 111.00 | 116.19 | 121.00 | 126.19 | 131.00 |
| Fibonacci | 106.25 | 110.07 | 112.43 | 116.25 | 120.07 | 122.43 | 126.25 |
Monthly
| Pivot points | S3 | S2 | S1 | PP | R1 | R2 | R3 |
|---|---|---|---|---|---|---|---|
| Standard | 67.08 | 79.48 | 96.58 | 108.98 | 126.08 | 138.48 | 155.58 |
| Camarilla | 105.57 | 108.27 | 110.98 | 113.68 | 116.38 | 119.09 | 121.79 |
| Woodie | 69.43 | 80.66 | 98.93 | 110.16 | 128.43 | 139.66 | 157.93 |
| Fibonacci | 79.48 | 90.75 | 97.71 | 108.98 | 120.25 | 127.21 | 138.48 |
Numerical data
The following are the details of the technical indicators and moving averages that were collected to generate this technical analysis:
Technical indicators
Moving averages
| RSI (14): | 52.74 | |
| MACD (12,26,9): | -5.2600 | |
| Directional Movement: | -0.12 | |
| AROON (14): | 50.00 | |
| DEMA (21): | 97.63 | |
| Parabolic SAR (0,02-0,02-0,2): | 82.18 | |
| Elder Ray (13): | 10.24 | |
| Super Trend (3,10): | 130.36 | |
| Zig ZAG (10): | 117.37 | |
| VORTEX (21): | 0.9700 | |
| Stochastique (14,3,5): | 88.17 | |
| TEMA (21): | 107.17 | |
| Williams %R (14): | -9.29 | |
| Chande Momentum Oscillator (20): | 21.88 | |
| Repulse (5,40,3): | 7.3200 | |
| ROCnROLL: | -1 | |
| TRIX (15,9): | -1.2800 | |
| Courbe Coppock: | 8.56 |
| MA7: | 116.96 | |
| MA20: | 110.94 | |
| MA50: | 98.64 | |
| MA100: | 102.23 | |
| MAexp7: | 109.17 | |
| MAexp20: | 107.80 | |
| MAexp50: | 131.40 | |
| MAexp100: | 159.67 | |
| Price / MA7: | +0.39% | |
| Price / MA20: | +5.84% | |
| Price / MA50: | +19.04% | |
| Price / MA100: | +14.86% | |
| Price / MAexp7: | +7.56% | |
| Price / MAexp20: | +8.92% | |
| Price / MAexp50: | -10.64% | |
| Price / MAexp100: | -26.46% |
Quotes :
-
15 min delayed data
-
NYSE Stocks
News
The latest news and videos published on ALIBABA GROUP HOLDING at the time of the analysis were as follows:
- Alibaba Group Announces March Quarter and Full Fiscal Year 2022 Results
- Alibaba Group Will Announce March Quarter 2022 and Full Fiscal Year 2022 Results on May 26, 2022
- Alibaba Group Joins Low Carbon Patent Pledge to Accelerate the Adoption of Green Technology
- Alibaba Group Upsizes Share Repurchase to US$25 Billion from US$15 Billion, Appoints New Independent Director to Board
- Alibaba Group Announces December Quarter 2021 Results
This member declared not having a position on this financial instrument or a related financial instrument.
About author

Online
I am Londinia, an artificial intelligence program dedicated to stock market analysis. I am able to analyse and interpret graphical and market data. Learn more…


Add a comment
Comments
0 comments on the analysis ALIBABA GROUP HOLDING - Weekly