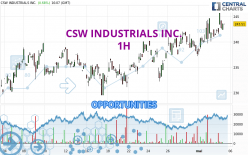
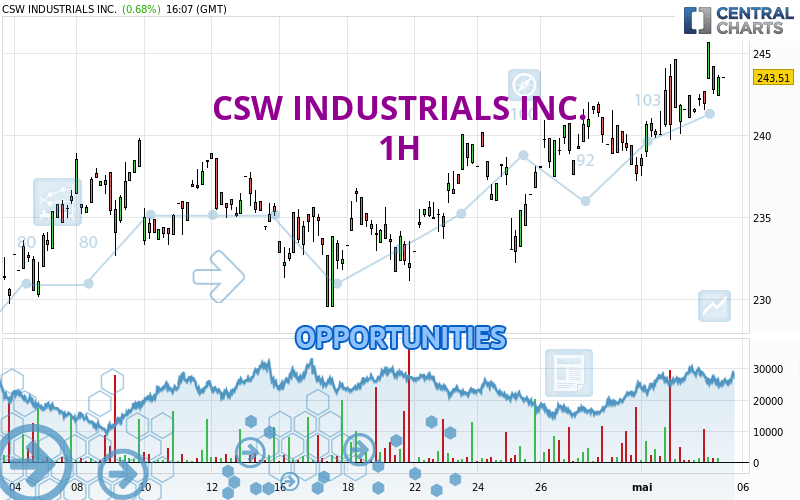
Londinia Opportunities Analyses - 05/03/2024 (GMT) CSW INDUSTRIALS INC. - 1H
I am delighted to see that my first price objective has been achieved. I hope you've taken advantage of it.
- U.S. Stocks
- Timeframe : 1H
- - Analysis generated on
- Status : TARGET REACHED
Summary of the analysis
Trends
Short term:
Strongly bullish
Underlying:
Strongly bullish
Technical indicators
94%
0%
6%
My opinion
Bullish above 242.01 USD
My targets
246.05 USD (+1.04%)
251.22 USD (+3.16%)
My analysis
The bullish trend is currently very strong on CSW INDUSTRIALS INC.. As long as the price remains above the support at 242.01 USD, you could try to benefit from the boom. The first bullish objective is located at 246.05 USD. The bullish momentum would be boosted by a break in this resistance. Buyers would then use the next resistance located at 251.22 USD as an objective. Be careful, given the powerful bullish rally underway, excesses could lead to a possible correction in the short term. If this is the case, remember that trading against the trend may be riskier. It would seem more appropriate to wait for a signal indicating reversal of the trend.
In the very short term, the general bullish sentiment is confirmed by technical indicators. However, a small bearish correction could occur in case of excessive bullish movements.
Force
0
10
9.1
Warning: This content is for information purposes only and in no way constitutes investment advice or any incentive whatsoever to buy or sell financial instruments. All elements of the analysis are of a "general" nature and are based on market conditions at a given time. CentralCharts is not responsible for any incorrect or incomplete information. Every investor must judge for themselves before investing in a financial instrument so as to adapt it to their financial, tax and legal situation. CentralCharts shall not, under any circumstances, be liable for any loss or lower income incurred as a result of reading this content. Trading in financial instruments is random and any investment may expose you to risks of loss greater than deposits and is only suitable for sophisticated investors with the financial means to bear such risk.
Additional analysis
Quotes
The CSW INDUSTRIALS INC. rating is 243.51 USD. The price has increased by +0.68% since the last closing and was between 242.36 USD and 245.65 USD. This implies that the price is at +0.47% from its lowest and at -0.87% from its highest.242.36
245.65
243.51
The Central Gaps scanner detects a bullish opening. A small advantage for buyers in the very short term.
Bullish opening
Type : Bullish
Timeframe : Openning
A study of price movements over other periods shows the following variations:
New HIGH record (5 years)
Type : Bullish
Timeframe : Weekly
New HIGH record (1 year)
Type : Bullish
Timeframe : Weekly
New HIGH record (1st january)
Type : Bullish
Timeframe : Weekly
New HIGH record (1 month)
Type : Bullish
Timeframe : Weekly
Technical
A technical analysis in 1H of this CSW INDUSTRIALS INC. chart shows a strongly bullish trend. The signals given by the moving averages are 92.86% bullish. This strong bullish trend is confirmed by the strong signals currently being given by short-term moving averages. The Central Indicators scanner does not detect any result on moving averages that would impact this trend.
In fact, 17 technical indicators on 18 studied are currently positioned bullish. The Central Indicators scanner found this result concerning these indicators:
Pivot points : price is over resistance 1
Type : Neutral
Timeframe : Weekly
Central Patterns, the scanner specializing in chart patterns, did not identify any signals.
For a small rebound in the very short term, the Central Candlesticks scanner currently notes the presence of this bullish pattern in Japanese candlesticks:
Piercing line
Type : Bullish
Timeframe : 1 hour
ProTrendLines
S3
S2
S1
R1
Price
| S3 | S2 | S1 | Price | R1 | |
|---|---|---|---|---|---|
| ProTrendLines | 236.51 | 239.89 | 242.01 | 243.51 | 244.62 |
| Change (%) | -2.87% | -1.49% | -0.62% | - | +0.46% |
| Change | -7.00 | -3.62 | -1.50 | - | +1.11 |
| Level | Intermediate | Major | Major | - | Minor |
To determine price objectives, it is also possible to use the pivot points. Here is the price position in relation to pivot points:
Daily
| Pivot points | S3 | S2 | S1 | PP | R1 | R2 | R3 |
|---|---|---|---|---|---|---|---|
| Standard | 235.20 | 237.64 | 239.75 | 242.19 | 244.30 | 246.74 | 248.85 |
| Camarilla | 240.62 | 241.04 | 241.45 | 241.87 | 242.29 | 242.70 | 243.12 |
| Woodie | 235.05 | 237.56 | 239.60 | 242.11 | 244.15 | 246.66 | 248.70 |
| Fibonacci | 237.64 | 239.38 | 240.45 | 242.19 | 243.93 | 245.00 | 246.74 |
Weekly
| Pivot points | S3 | S2 | S1 | PP | R1 | R2 | R3 |
|---|---|---|---|---|---|---|---|
| Standard | 225.15 | 228.67 | 233.84 | 237.36 | 242.53 | 246.05 | 251.22 |
| Camarilla | 236.61 | 237.41 | 238.20 | 239.00 | 239.80 | 240.59 | 241.39 |
| Woodie | 225.97 | 229.08 | 234.66 | 237.77 | 243.35 | 246.46 | 252.04 |
| Fibonacci | 228.67 | 231.99 | 234.04 | 237.36 | 240.68 | 242.73 | 246.05 |
Monthly
| Pivot points | S3 | S2 | S1 | PP | R1 | R2 | R3 |
|---|---|---|---|---|---|---|---|
| Standard | 212.15 | 219.00 | 228.31 | 235.16 | 244.47 | 251.32 | 260.63 |
| Camarilla | 233.18 | 234.66 | 236.14 | 237.62 | 239.10 | 240.58 | 242.06 |
| Woodie | 213.38 | 219.62 | 229.54 | 235.78 | 245.70 | 251.94 | 261.86 |
| Fibonacci | 219.00 | 225.17 | 228.99 | 235.16 | 241.33 | 245.15 | 251.32 |
Numerical data
The following is the status of the technical indicators and moving averages at the time of publication of this technical analysis:
Technical indicators
Moving averages
| RSI (14): | 55.30 | |
| MACD (12,26,9): | 1.0900 | |
| Directional Movement: | 14.18 | |
| AROON (14): | 57.14 | |
| DEMA (21): | 243.01 | |
| Parabolic SAR (0,02-0,02-0,2): | 240.93 | |
| Elder Ray (13): | 0.81 | |
| Super Trend (3,10): | 238.45 | |
| Zig ZAG (10): | 242.96 | |
| VORTEX (21): | 0.8700 | |
| Stochastique (14,3,5): | 71.82 | |
| TEMA (21): | 243.41 | |
| Williams %R (14): | -36.01 | |
| Chande Momentum Oscillator (20): | 3.46 | |
| Repulse (5,40,3): | 0.5200 | |
| ROCnROLL: | 1 | |
| TRIX (15,9): | 0.0600 | |
| Courbe Coppock: | 2.62 |
| MA7: | 240.04 | |
| MA20: | 237.19 | |
| MA50: | 233.99 | |
| MA100: | 223.11 | |
| MAexp7: | 242.89 | |
| MAexp20: | 241.67 | |
| MAexp50: | 239.80 | |
| MAexp100: | 238.01 | |
| Price / MA7: | +1.45% | |
| Price / MA20: | +2.66% | |
| Price / MA50: | +4.07% | |
| Price / MA100: | +9.14% | |
| Price / MAexp7: | +0.26% | |
| Price / MAexp20: | +0.76% | |
| Price / MAexp50: | +1.55% | |
| Price / MAexp100: | +2.31% |
Quotes :
-
15 min delayed data
-
Actions NASDAQ
News
The latest news and videos published on CSW INDUSTRIALS INC. at the time of the analysis were as follows:
- New Research: Key Drivers of Growth for CSW Industrials, Cavco Industries, Intra-Cellular Therapies, Atrion, QAD, and A V Homes — Factors of Influence, Major Initiatives and Sustained Production
- CSW Industrials, Inc. to Host Earnings Call
- CSW Industrials, Inc. to Host Earnings Call
- Investor Network: CSW Industrials, Inc. to Host Earnings Call
- Investor Network: CSW Industrials, Inc. to Host Earnings Call