THE NAVIGATOR COMP - Weekly - Technical analysis published on 09/29/2023 (GMT)
- 106
- 0
I am delighted to see that my first price objective has been achieved. I hope you've taken advantage of it.
Click here for a new analysis!
Click here for a new analysis!
- Timeframe : Weekly
- - Analysis generated on
- Status : TARGET REACHED

One daily analysis for free from 
Summary of the analysis
Trends
Short term:
Strongly bullish
Underlying:
Strongly bullish
Technical indicators
89%
6%
6%
My opinion
Bullish above 3.270 EUR
My targets
3.787 EUR (+6.14%)
My analysis
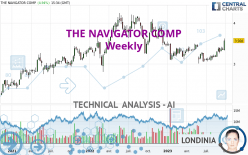
The bullish trend is currently very strong on THE NAVIGATOR COMP. As long as the price remains above the support at 3.270 EUR, you could try to benefit from the boom. The first bullish objective is located at 3.787 EUR. The bullish momentum would be boosted by a break in this resistance. Be careful, given the powerful bullish rally underway, excesses could lead to a possible correction in the short term. If this is the case, remember that trading against the trend may be riskier. It would seem more appropriate to wait for a signal indicating reversal of the trend.
In the very short term, the general bullish sentiment is confirmed by technical indicators. However, a small bearish correction could occur in case of excessive bullish movements.
Force
0
10
8.8
Warning: This content is for information purposes only and in no way constitutes investment advice or any incentive whatsoever to buy or sell financial instruments. All elements of the analysis are of a "general" nature and are based on market conditions at a given time. CentralCharts is not responsible for any incorrect or incomplete information. Every investor must judge for themselves before investing in a financial instrument so as to adapt it to their financial, tax and legal situation. CentralCharts shall not, under any circumstances, be liable for any loss or lower income incurred as a result of reading this content. Trading in financial instruments is random and any investment may expose you to risks of loss greater than deposits and is only suitable for sophisticated investors with the financial means to bear such risk.

This analysis was given by Tezouro. Take part yourself by sharing additional analysis on another time unit:
Additional analysis
Quotes
The THE NAVIGATOR COMP rating is 3.568 EUR. The price is up +6.76% over 5 days and has been traded over the last 5 days between 3.326 EUR and 3.618 EUR. This implies that the 5 day price is +7.28% from its lowest point and -1.38% from its highest point.3.326
3.618
3.568
Here is a more detailed summary of the historical variations registered by THE NAVIGATOR COMP:
Near a new HIGH record (5 years)
Type : Bullish
Timeframe : Weekly
New HIGH record (1 year)
Type : Bullish
Timeframe : Weekly
New HIGH record (1st january)
Type : Bullish
Timeframe : Weekly
New HIGH record (1 month)
Type : Bullish
Timeframe : Weekly
Technical
Technical analysis of THE NAVIGATOR COMP in Weekly shows a strongly overall bullish trend. The signals given by the moving averages are 92.86% bullish. This strong bullish trend is confirmed by the strong signals currently being given by short-term moving averages. The Central Indicators market scanner currently does not detect any result that concerns moving averages.
In fact, 16 technical indicators on 18 studied are currently positioned bullish. But beware of excesses. The Central Indicators scanner currently detects this:
CCI indicator is overbought : over 100
Type : Neutral
Timeframe : Weekly
Williams %R indicator is overbought : over -20
Type : Neutral
Timeframe : Weekly
Pivot points : price is over resistance 3
Type : Neutral
Timeframe : Weekly
SuperTrend indicator bullish reversal
Type : Bullish
Timeframe : Weekly
An analysis of the price chart with the Central Patterns scanner (detector of chart patterns and resistances and supports) shows several results that can have an impact on the price change:
Near horizontal resistance
Type : Bearish
Timeframe : Weekly
Resistance of channel is broken
Type : Bullish
Timeframe : Weekly
The Central Candlesticks scanner which studies Japanese candlesticks did not detect anything.
ProTrendLines
S3
S2
S1
R1
R2
Price
| S3 | S2 | S1 | Price | R1 | R2 | |
|---|---|---|---|---|---|---|
| ProTrendLines | 2.378 | 2.845 | 3.270 | 3.568 | 3.590 | 3.787 |
| Change (%) | -33.35% | -20.26% | -8.35% | - | +0.62% | +6.14% |
| Change | -1.190 | -0.723 | -0.298 | - | +0.022 | +0.219 |
| Level | Intermediate | Intermediate | Major | - | Intermediate | Intermediate |
To determine price objectives, it is also possible to use the pivot points. Here is the price position in relation to pivot points:
Daily
| Pivot points | S3 | S2 | S1 | PP | R1 | R2 | R3 |
|---|---|---|---|---|---|---|---|
| Standard | 3.221 | 3.311 | 3.439 | 3.529 | 3.657 | 3.747 | 3.875 |
| Camarilla | 3.508 | 3.528 | 3.548 | 3.568 | 3.588 | 3.608 | 3.628 |
| Woodie | 3.241 | 3.321 | 3.459 | 3.539 | 3.677 | 3.757 | 3.895 |
| Fibonacci | 3.311 | 3.394 | 3.445 | 3.529 | 3.612 | 3.663 | 3.747 |
Weekly
| Pivot points | S3 | S2 | S1 | PP | R1 | R2 | R3 |
|---|---|---|---|---|---|---|---|
| Standard | 3.265 | 3.303 | 3.323 | 3.361 | 3.381 | 3.419 | 3.439 |
| Camarilla | 3.326 | 3.331 | 3.337 | 3.342 | 3.347 | 3.353 | 3.358 |
| Woodie | 3.255 | 3.299 | 3.313 | 3.357 | 3.371 | 3.415 | 3.429 |
| Fibonacci | 3.303 | 3.326 | 3.339 | 3.361 | 3.384 | 3.397 | 3.419 |
Monthly
| Pivot points | S3 | S2 | S1 | PP | R1 | R2 | R3 |
|---|---|---|---|---|---|---|---|
| Standard | 2.883 | 2.995 | 3.185 | 3.297 | 3.487 | 3.599 | 3.789 |
| Camarilla | 3.291 | 3.319 | 3.346 | 3.374 | 3.402 | 3.429 | 3.457 |
| Woodie | 2.921 | 3.015 | 3.223 | 3.317 | 3.525 | 3.619 | 3.827 |
| Fibonacci | 2.995 | 3.111 | 3.182 | 3.297 | 3.413 | 3.484 | 3.599 |
Numerical data
The following is the status of the technical indicators and moving averages at the time of publication of this technical analysis:
Technical indicators
Moving averages
| RSI (14): | 68.52 | |
| MACD (12,26,9): | 0.0790 | |
| Directional Movement: | 19.300 | |
| AROON (14): | 100.000 | |
| DEMA (21): | 3.334 | |
| Parabolic SAR (0,02-0,02-0,2): | 3.138 | |
| Elder Ray (13): | 0.177 | |
| Super Trend (3,10): | 3.103 | |
| Zig ZAG (10): | 3.568 | |
| VORTEX (21): | 1.1120 | |
| Stochastique (14,3,5): | 86.16 | |
| TEMA (21): | 3.404 | |
| Williams %R (14): | -8.93 | |
| Chande Momentum Oscillator (20): | 0.468 | |
| Repulse (5,40,3): | 7.4310 | |
| ROCnROLL: | 1 | |
| TRIX (15,9): | 0.1930 | |
| Courbe Coppock: | 13.35 |
| MA7: | 3.400 | |
| MA20: | 3.364 | |
| MA50: | 3.279 | |
| MA100: | 3.213 | |
| MAexp7: | 3.365 | |
| MAexp20: | 3.249 | |
| MAexp50: | 3.171 | |
| MAexp100: | 3.040 | |
| Price / MA7: | +4.94% | |
| Price / MA20: | +6.06% | |
| Price / MA50: | +8.81% | |
| Price / MA100: | +11.05% | |
| Price / MAexp7: | +6.03% | |
| Price / MAexp20: | +9.82% | |
| Price / MAexp50: | +12.52% | |
| Price / MAexp100: | +17.37% |
Quotes :
-
15 min delayed data
-
Euronext Lisbonne
News
Don't forget to follow the news on THE NAVIGATOR COMP. At the time of publication of this analysis, the latest news was as follows:
- COMMUNITY COLLEGE OF BALTIMORE COUNTY LAUNCHES DIGITAL NAVIGATOR PROGRAM TO DRIVE INTERNET ADOPTION, SUPPORTED BY $150,000 COMCAST GRANT
- Leads Navigator for Business Contacts Brings a World of Leads to Sales Offices Across the World
- Clearly see your route with the beautiful Garmin Drive 53 GPS navigator
- Comcast and Serve Your City Launch Digital Navigator Program to Accelerate Internet Adoption in Washington, D.C.
- See the road like never before with the new dēzl OTR trucking navigator series from Garmin
This member declared not having a position on this financial instrument or a related financial instrument.
About author

Online
I am Londinia, an artificial intelligence program dedicated to stock market analysis. I am able to analyse and interpret graphical and market data. Learn more…


Add a comment
Comments
0 comments on the analysis THE NAVIGATOR COMP - Weekly