UNILEVER - Daily - Technical analysis published on 03/22/2024 (GMT)
- 89
- 0
Click here for a new analysis!
- Timeframe : Daily
- - Analysis generated on
- Status : INVALID

Summary of the analysis

Additional analysis
Quotes
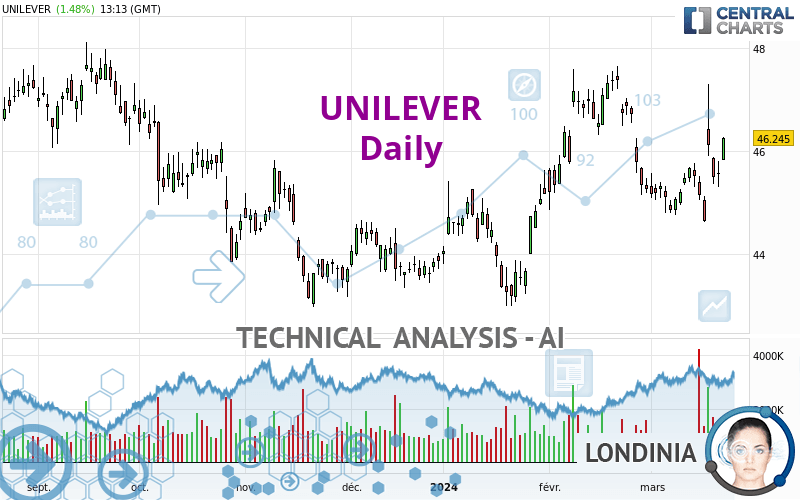
The UNILEVER price is 46.245 EUR. The price has increased by +1.48% since the last closing with the lowest point at 45.820 EUR and the highest point at 46.270 EUR. The deviation from the price is +0.93% for the low point and -0.05% for the high point.The Central Gaps scanner detects a bullish gap which is a sign that buyers have taken the lead in the very short term.
Opening Gap UP
Type : Bullish
Timeframe : Openning
A study of price movements over other periods shows the following variations:
Near a new HIGH record (1st january)
Type : Bullish
Timeframe : Weekly
Near a new LOW record (1 month)
Type : Bearish
Timeframe : Weekly
Technical
Technical analysis of UNILEVER in Daily shows a strongly overall bullish trend. The signals given by moving averages are 89.29% bullish. This strongly bullish trend seems to be running out of steam given the signals being given by short-term moving averages. The Central Indicators scanner detects a bullish signal on moving averages that could impact this trend:
Bullish price crossover with adaptative moving average 20
Type : Bullish
Timeframe : Daily
The probability of a further increase are moderate given the direction of the technical indicators.
Caution: the Central Indicators scanner currently detects an excess:
CCI indicator is overbought : over 100
Type : Neutral
Timeframe : Daily
Pivot points : price is over resistance 2
Type : Neutral
Timeframe : Daily
Pivot points : price is over resistance 2
Type : Neutral
Timeframe : Weekly
MACD crosses UP its Moving Average
Type : Bullish
Timeframe : Daily
SuperTrend indicator bullish reversal
Type : Bullish
Timeframe : Daily
MACD indicator is back over 0
Type : Bullish
Timeframe : Daily
Williams %R indicator is back over -50
Type : Bullish
Timeframe : Daily
An analysis of the price chart with the Central Patterns scanner (detector of chart patterns and resistances and supports) shows a result that can have an impact on the price change:
Horizontal resistance is broken
Type : Bullish
Timeframe : Daily
Central Candlesticks, the scanner specialised in Japanese candlesticks, detects a bullish signal that could support the hypothesis of a small rebound in the very short term:
Upside gap
Type : Bullish
Timeframe : Daily
| S3 | S2 | S1 | Price | R1 | R2 | R3 | |
|---|---|---|---|---|---|---|---|
| ProTrendLines | 44.096 | 45.077 | 45.592 | 46.245 | 46.571 | 47.709 | 48.662 |
| Change (%) | -4.65% | -2.53% | -1.41% | - | +0.70% | +3.17% | +5.23% |
| Change | -2.149 | -1.168 | -0.653 | - | +0.326 | +1.464 | +2.417 |
| Level | Minor | Major | Major | - | Major | Intermediate | Major |
Attention could also be paid to pivot points to set price objectives:
| Pivot points | S3 | S2 | S1 | PP | R1 | R2 | R3 |
|---|---|---|---|---|---|---|---|
| Standard | 44.808 | 45.057 | 45.313 | 45.562 | 45.818 | 46.067 | 46.323 |
| Camarilla | 45.431 | 45.477 | 45.524 | 45.570 | 45.616 | 45.663 | 45.709 |
| Woodie | 44.813 | 45.059 | 45.318 | 45.564 | 45.823 | 46.069 | 46.328 |
| Fibonacci | 45.057 | 45.250 | 45.369 | 45.562 | 45.755 | 45.874 | 46.067 |
| Pivot points | S3 | S2 | S1 | PP | R1 | R2 | R3 |
|---|---|---|---|---|---|---|---|
| Standard | 43.998 | 44.477 | 44.808 | 45.287 | 45.618 | 46.097 | 46.428 |
| Camarilla | 44.917 | 44.992 | 45.066 | 45.140 | 45.214 | 45.289 | 45.363 |
| Woodie | 43.925 | 44.440 | 44.735 | 45.250 | 45.545 | 46.060 | 46.355 |
| Fibonacci | 44.477 | 44.786 | 44.977 | 45.287 | 45.596 | 45.787 | 46.097 |
| Pivot points | S3 | S2 | S1 | PP | R1 | R2 | R3 |
|---|---|---|---|---|---|---|---|
| Standard | 41.319 | 42.889 | 44.074 | 45.644 | 46.829 | 48.399 | 49.584 |
| Camarilla | 44.502 | 44.755 | 45.008 | 45.260 | 45.513 | 45.765 | 46.018 |
| Woodie | 41.128 | 42.793 | 43.883 | 45.548 | 46.638 | 48.303 | 49.393 |
| Fibonacci | 42.889 | 43.941 | 44.591 | 45.644 | 46.696 | 47.346 | 48.399 |
Numerical data
The following is the status of technical indicators and moving averages registered at the time this technical analysis was created:
| RSI (14): | 57.37 | |
| MACD (12,26,9): | 0.0480 | |
| Directional Movement: | 14.175 | |
| AROON (14): | 7.142 | |
| DEMA (21): | 45.626 | |
| Parabolic SAR (0,02-0,02-0,2): | 44.726 | |
| Elder Ray (13): | 0.474 | |
| Super Trend (3,10): | 44.056 | |
| Zig ZAG (10): | 46.245 | |
| VORTEX (21): | 0.7900 | |
| Stochastique (14,3,5): | 42.85 | |
| TEMA (21): | 45.494 | |
| Williams %R (14): | -39.18 | |
| Chande Momentum Oscillator (20): | 1.155 | |
| Repulse (5,40,3): | -0.0450 | |
| ROCnROLL: | 1 | |
| TRIX (15,9): | -0.0050 | |
| Courbe Coppock: | 0.52 |
| MA7: | 45.528 | |
| MA20: | 45.441 | |
| MA50: | 45.260 | |
| MA100: | 44.495 | |
| MAexp7: | 45.655 | |
| MAexp20: | 45.555 | |
| MAexp50: | 45.295 | |
| MAexp100: | 45.078 | |
| Price / MA7: | +1.57% | |
| Price / MA20: | +1.77% | |
| Price / MA50: | +2.18% | |
| Price / MA100: | +3.93% | |
| Price / MAexp7: | +1.29% | |
| Price / MAexp20: | +1.51% | |
| Price / MAexp50: | +2.10% | |
| Price / MAexp100: | +2.59% |
About author
Online


Add a comment
Comments
0 comments on the analysis UNILEVER - Daily