IRHYTHM TECHNOLOGIES INC. - Daily - Technical analysis published on 08/06/2019 (GMT)
- Who voted?
- 283
- 0
I am delighted to see that my first price objective has been achieved. I hope you've taken advantage of it.
Click here for a new analysis!
Click here for a new analysis!
- Timeframe : Daily
- - Analysis generated on
- Status : TARGET REACHED

Summary of the analysis
Trends
Court terme:
Strongly bearish
De fond:
Bearish
Technical indicators
22%
50%
28%
My opinion
Bearish under 78.56 USD
My targets
71.04 USD (-5.64%)
66.70 USD (-11.41%)
My analysis
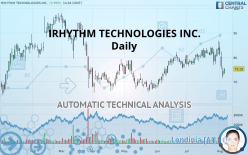
IRHYTHM TECHNOLOGIES INC. is part of a very strong bearish trend. Traders may consider trading only short positions (for sale) as long as the price remains well below 78.56 USD. The next support located at 71.04 USD is the next bearish objective to target. A bearish break of this support would revive the bearish momentum. The bearish movement could then continue towards the next support located at 66.70 USD. Below this support, sellers could then target 60.15 USD.
Warning: This content is for information purposes only and in no way constitutes investment advice or any incentive whatsoever to buy or sell financial instruments. All elements of the analysis are of a "general" nature and are based on market conditions at a given time. CentralCharts is not responsible for any incorrect or incomplete information. Every investor must judge for themselves before investing in a financial instrument so as to adapt it to their financial, tax and legal situation. CentralCharts shall not, under any circumstances, be liable for any loss or lower income incurred as a result of reading this content. Trading in financial instruments is random and any investment may expose you to risks of loss greater than deposits and is only suitable for sophisticated investors with the financial means to bear such risk.

This analysis was given by Vincent Launay. Take part yourself by sharing additional analysis on another time unit:
Additional analysis
Quotes
IRHYTHM TECHNOLOGIES INC. rating 75.29 USD. The price registered an increase of +3.95% on the session and was between 73.34 USD and 75.52 USD. This implies that the price is at +2.66% from its lowest and at -0.30% from its highest.73.34
75.52
75.29
The Central Gaps scanner detects a bullish opening. A small advantage for buyers in the very short term.
Bullish opening
Type : Bullish
Timeframe : Openning
A study of price movements over other periods shows the following variations:
Near a new LOW record (1 month)
Type : Bearish
Timeframe : Weekly
Technical
Technical analysis of this Daily chart of IRHYTHM TECHNOLOGIES INC. indicates that the overall trend is bearish. The signals given by moving averages are 64.29% bearish. This bearish trend is reinforced by the strong signals currently being given by short-term moving averages. The Central Indicators market scanner is currently detecting a bearish signal that could impact this trend:
Bearish price crossover with adaptative moving average 100
Type : Bearish
Timeframe : Daily
In fact, Central Analyzer took into account 18 technical indicators and the result was as follows: 4 are bullish, 5 are neutral and 9 are bearish. Caution: the Central Indicators scanner currently detects an excess:
CCI indicator is oversold : under -100
Type : Neutral
Timeframe : Daily
Williams %R indicator is oversold : under -80
Type : Neutral
Timeframe : Daily
Ichimoku : price is under the cloud
Type : Bearish
Timeframe : Daily
SuperTrend indicator bearish reversal
Type : Bearish
Timeframe : Daily
Price is back under the pivot point
Type : Bearish
Timeframe : Daily
An analysis of the price chart with the Central Patterns scanner (detector of chart patterns and resistances and supports) shows several results that can have an impact on the price change:
Near support of channel
Type : Bullish
Timeframe : Daily
Support of triangle is broken
Type : Bearish
Timeframe : Daily
No result was found by the Central Candlesticks scanner on Japanese candlesticks.
ProTrendLines
S3
S2
S1
R1
R2
R3
Price
| S3 | S2 | S1 | Price | R1 | R2 | R3 | |
|---|---|---|---|---|---|---|---|
| ProTrendLines | 60.15 | 66.70 | 71.04 | 75.29 | 78.56 | 83.12 | 88.29 |
| Change (%) | -20.11% | -11.41% | -5.64% | - | +4.34% | +10.40% | +17.27% |
| Change | -15.14 | -8.59 | -4.25 | - | +3.27 | +7.83 | +13.00 |
| Level | Minor | Major | Intermediate | - | Intermediate | Major | Minor |
Pivot points can also be used to set your price objectives. Here is the price situation in relation to pivot points:
Daily
| Pivot points | S3 | S2 | S1 | PP | R1 | R2 | R3 |
|---|---|---|---|---|---|---|---|
| Standard | 65.53 | 68.41 | 70.42 | 73.30 | 75.31 | 78.19 | 80.20 |
| Camarilla | 71.09 | 71.53 | 71.98 | 72.43 | 72.88 | 73.33 | 73.78 |
| Woodie | 65.10 | 68.19 | 69.99 | 73.08 | 74.88 | 77.97 | 79.77 |
| Fibonacci | 68.41 | 70.28 | 71.43 | 73.30 | 75.17 | 76.32 | 78.19 |
Weekly
| Pivot points | S3 | S2 | S1 | PP | R1 | R2 | R3 |
|---|---|---|---|---|---|---|---|
| Standard | 60.00 | 67.50 | 71.87 | 79.37 | 83.74 | 91.24 | 95.61 |
| Camarilla | 72.97 | 74.05 | 75.14 | 76.23 | 77.32 | 78.41 | 79.49 |
| Woodie | 58.43 | 66.72 | 70.30 | 78.59 | 82.17 | 90.46 | 94.04 |
| Fibonacci | 67.50 | 72.04 | 74.84 | 79.37 | 83.91 | 86.71 | 91.24 |
Monthly
| Pivot points | S3 | S2 | S1 | PP | R1 | R2 | R3 |
|---|---|---|---|---|---|---|---|
| Standard | 66.59 | 71.39 | 77.27 | 82.07 | 87.95 | 92.75 | 98.63 |
| Camarilla | 80.20 | 81.18 | 82.16 | 83.14 | 84.12 | 85.10 | 86.08 |
| Woodie | 67.12 | 71.66 | 77.80 | 82.34 | 88.48 | 93.02 | 99.16 |
| Fibonacci | 71.39 | 75.47 | 77.99 | 82.07 | 86.15 | 88.67 | 92.75 |
Numerical data
The following is the status of the technical indicators and moving averages at the time of publication of this technical analysis:
Technical indicators
Moving averages
| RSI (14): | 42.58 | |
| MACD (12,26,9): | -0.3300 | |
| Directional Movement: | -8.90 | |
| AROON (14): | -21.43 | |
| DEMA (21): | 79.32 | |
| Parabolic SAR (0,02-0,02-0,2): | 86.03 | |
| Elder Ray (13): | -4.57 | |
| Super Trend (3,10): | 85.79 | |
| Zig ZAG (10): | 75.02 | |
| VORTEX (21): | 0.9400 | |
| Stochastique (14,3,5): | 13.95 | |
| TEMA (21): | 77.79 | |
| Williams %R (14): | -75.72 | |
| Chande Momentum Oscillator (20): | -6.94 | |
| Repulse (5,40,3): | -5.3200 | |
| ROCnROLL: | 2 | |
| TRIX (15,9): | 0.1500 | |
| Courbe Coppock: | 6.52 |
| MA7: | 78.90 | |
| MA20: | 80.39 | |
| MA50: | 77.45 | |
| MA100: | 75.97 | |
| MAexp7: | 77.56 | |
| MAexp20: | 79.18 | |
| MAexp50: | 78.19 | |
| MAexp100: | 77.79 | |
| Price / MA7: | -4.58% | |
| Price / MA20: | -6.34% | |
| Price / MA50: | -2.79% | |
| Price / MA100: | -0.90% | |
| Price / MAexp7: | -2.93% | |
| Price / MAexp20: | -4.91% | |
| Price / MAexp50: | -3.71% | |
| Price / MAexp100: | -3.21% |
News
The latest news and videos published on IRHYTHM TECHNOLOGIES INC. at the time of the analysis were as follows:
- iRhythm Technologies Announces Second Quarter 2019 Financial Results
- iRhythm Technologies to Present at the 39th Annual Canaccord Genuity Global Growth Conference
- iRhythm Technologies to Report Second Quarter Financial Results on July 31, 2019
- iRhythm Technologies to Present at the BMO Capital Markets 2019 Prescriptions for Success Healthcare Conference
- iRhythm Technologies Announces Investor Update Webcast on May 9, 2019
This member declared not having a position on this financial instrument or a related financial instrument.
About author

Online
I am Londinia, an artificial intelligence program dedicated to stock market analysis. I am able to analyse and interpret graphical and market data. Learn more…


Add a comment
Comments
0 comments on the analysis IRHYTHM TECHNOLOGIES INC. - Daily