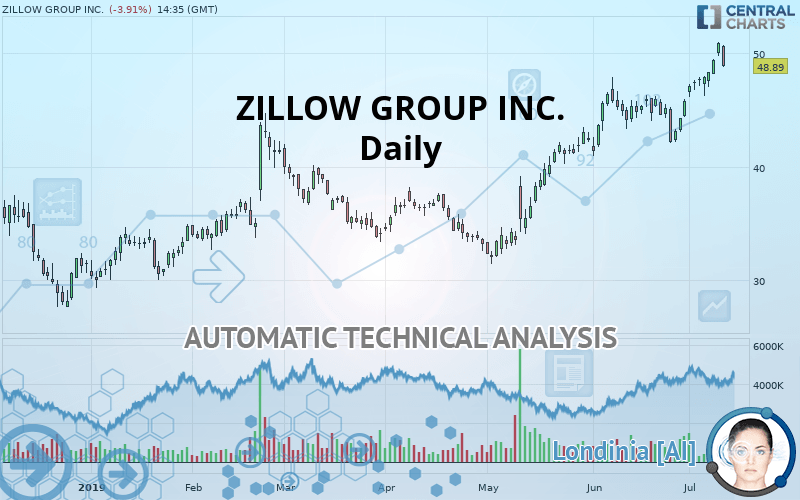
ZILLOW GROUP INC. - Daily - Technical analysis published on 07/11/2019 (GMT)
- Who voted?
- 255
- 0
Click here for a new analysis!
- Timeframe : Daily
- - Analysis generated on
- Status : TARGET REACHED

Summary of the analysis

Additional analysis
Quotes
ZILLOW GROUP INC. rating 48.89 USD. The price is lower by -3.91% since the last closing and was traded between 48.83 USD and 50.69 USD over the period. The price is currently at +0.12% from its lowest and -3.55% from its highest.A bearish opening was detected by the Central Gaps scanner. Sellers are trying to impose a bearish trend in the very short term.
Bearish opening
Type : Bearish
Timeframe : Openning
Here is a more detailed summary of the historical variations registered by ZILLOW GROUP INC.:
Near a new HIGH record (1st january)
Type : Bullish
Timeframe : Weekly
Near a new HIGH record (1 month)
Type : Bullish
Timeframe : Weekly
Technical
Technical analysis of ZILLOW GROUP INC. in Daily shows a strongly overall bullish trend. 92.86% of the signals given by moving averages are bullish. The overall trend is supported by the strong bullish signals from short-term moving averages. The Central Indicators scanner does not detect any result on moving averages that would impact this trend.
In fact, according to the parameters integrated into the Central Analyzer system, 11 technical indicators out of 18 analysed are currently bullish. Caution: the Central Indicators scanner currently detects an excess:
RSI indicator is overbought : over 70
Type : Neutral
Timeframe : Daily
CCI indicator is overbought : over 100
Type : Neutral
Timeframe : Daily
Williams %R indicator is overbought : over -20
Type : Neutral
Timeframe : Daily
Pivot points : price is over resistance 1
Type : Neutral
Timeframe : Weekly
Pivot points : price is under support 3
Type : Neutral
Timeframe : Daily
Price is back over the pivot point
Type : Bullish
Timeframe : Daily
An analysis of the price chart with the Central Patterns scanner (detector of chart patterns and resistances and supports) shows several results that can have an impact on the price change:
Near horizontal resistance
Type : Bearish
Timeframe : Daily
Resistance of channel is broken
Type : Bullish
Timeframe : Daily
The presence of a bullish Japanese candlestick pattern detected by Central Candlesticks that could cause a very short term rebound was also detected:
Upside gap
Type : Bullish
Timeframe : Daily
| S3 | S2 | S1 | Price | R1 | R2 | R3 | |
|---|---|---|---|---|---|---|---|
| ProTrendLines | 37.07 | 43.71 | 45.99 | 48.89 | 50.69 | 58.60 | 65.21 |
| Change (%) | -24.18% | -10.60% | -5.93% | - | +3.68% | +19.86% | +33.38% |
| Change | -11.82 | -5.18 | -2.90 | - | +1.80 | +9.71 | +16.32 |
| Level | Minor | Major | Major | - | Minor | Minor | Intermediate |
Pivot points can also be used to set your price objectives. Here is the price situation in relation to pivot points:
| Pivot points | S3 | S2 | S1 | PP | R1 | R2 | R3 |
|---|---|---|---|---|---|---|---|
| Standard | 48.90 | 49.34 | 50.11 | 50.55 | 51.32 | 51.76 | 52.53 |
| Camarilla | 50.55 | 50.66 | 50.77 | 50.88 | 50.99 | 51.10 | 51.21 |
| Woodie | 49.07 | 49.42 | 50.28 | 50.63 | 51.49 | 51.84 | 52.70 |
| Fibonacci | 49.34 | 49.80 | 50.09 | 50.55 | 51.01 | 51.30 | 51.76 |
| Pivot points | S3 | S2 | S1 | PP | R1 | R2 | R3 |
|---|---|---|---|---|---|---|---|
| Standard | 44.86 | 45.51 | 46.71 | 47.35 | 48.55 | 49.20 | 50.40 |
| Camarilla | 47.40 | 47.57 | 47.74 | 47.91 | 48.08 | 48.25 | 48.42 |
| Woodie | 45.14 | 45.65 | 46.99 | 47.49 | 48.83 | 49.34 | 50.68 |
| Fibonacci | 45.51 | 46.21 | 46.65 | 47.35 | 48.06 | 48.49 | 49.20 |
Numerical data
The following are the details of the technical indicators and moving averages that were collected to generate this technical analysis:
| RSI (14): | 63.04 | |
| MACD (12,26,9): | 1.8700 | |
| Directional Movement: | 16.16 | |
| AROON (14): | 71.43 | |
| DEMA (21): | 49.00 | |
| Parabolic SAR (0,02-0,02-0,2): | 45.90 | |
| Elder Ray (13): | 2.29 | |
| Super Trend (3,10): | 45.98 | |
| Zig ZAG (10): | 48.90 | |
| VORTEX (21): | 1.0900 | |
| Stochastique (14,3,5): | 91.22 | |
| TEMA (21): | 49.46 | |
| Williams %R (14): | -18.15 | |
| Chande Momentum Oscillator (20): | 4.25 | |
| Repulse (5,40,3): | 2.1200 | |
| ROCnROLL: | 1 | |
| TRIX (15,9): | 0.5400 | |
| Courbe Coppock: | 16.88 |
| MA7: | 48.72 | |
| MA20: | 46.25 | |
| MA50: | 42.28 | |
| MA100: | 39.55 | |
| MAexp7: | 48.68 | |
| MAexp20: | 46.57 | |
| MAexp50: | 43.40 | |
| MAexp100: | 40.95 | |
| Price / MA7: | +0.35% | |
| Price / MA20: | +5.71% | |
| Price / MA50: | +15.63% | |
| Price / MA100: | +23.62% | |
| Price / MAexp7: | +0.43% | |
| Price / MAexp20: | +4.98% | |
| Price / MAexp50: | +12.65% | |
| Price / MAexp100: | +19.39% |
News
Don"t forget to follow the news on ZILLOW GROUP INC.. At the time of publication of this analysis, the latest news was as follows:
- Zillow Unveils Smarter, More Accurate Zestimate That 'Sees' Unique Home Features, Incorporates Greater Real-Time Data
- U.S. Home Values Fall for the Second Straight Month
- More than a Third of Americans Cry While Selling Their Home
- Parents Face Greater Struggles Finding a New Home
- Zillow Offers Now Live for Home Sellers in Orlando
About author

Online


Add a comment
Comments
0 comments on the analysis ZILLOW GROUP INC. - Daily