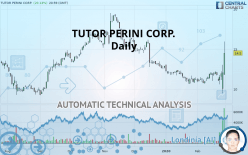
TUTOR PERINI CORP. - Daily - Technical analysis published on 03/02/2020 (GMT)
- Who voted?
- 271
- 0
Oops, I was wrong about that analysis. My threshold for invalidation has been broken.
Click here for a new analysis!
Click here for a new analysis!
- Timeframe : Daily
- - Analysis generated on
- Status : INVALID

Summary of the analysis
Trends
Court terme:
Strongly bullish
De fond:
Bullish
Technical indicators
67%
11%
22%
My opinion
Bullish above 14.06 USD
My targets
15.88 USD (+9.52%)
16.88 USD (+16.41%)
My analysis
In the short term, there could be an acceleration of the basic bullish trend on TUTOR PERINI CORP.. This is a positive signal for buyers. As long as the price remains above 14.06 USD, a purchase could be considered. The first bullish objective is located at 15.88 USD. The bullish momentum would be boosted by a break in this resistance. Buyers would then use the next resistance located at 16.88 USD as an objective. Crossing it would then enable buyers to target 19.17 USD. In the event of a return below 14.06 USD, the price would probably only initiate a small short-term correction to improve the bullish trend. Trading this correction may be risky.
In the very short term, the general bullish sentiment is confirmed by technical indicators. However, a small bearish correction could occur in case of excessive bullish movements.
FORCE
0
10
5.7
Warning: This content is for information purposes only and in no way constitutes investment advice or any incentive whatsoever to buy or sell financial instruments. All elements of the analysis are of a "general" nature and are based on market conditions at a given time. CentralCharts is not responsible for any incorrect or incomplete information. Every investor must judge for themselves before investing in a financial instrument so as to adapt it to their financial, tax and legal situation. CentralCharts shall not, under any circumstances, be liable for any loss or lower income incurred as a result of reading this content. Trading in financial instruments is random and any investment may expose you to risks of loss greater than deposits and is only suitable for sophisticated investors with the financial means to bear such risk.

This analysis was given by Vincent Launay. Take part yourself by sharing additional analysis on another time unit:
Additional analysis
Quotes
The TUTOR PERINI CORP. price is 14.50 USD. The price registered an increase of +20.13% on the session with the lowest point at 11.80 USD and the highest point at 15.92 USD. The deviation from the price is +22.88% for the low point and -8.92% for the high point.11.80
15.92
14.50
Here is a more detailed summary of the historical variations registered by TUTOR PERINI CORP.:
Near a new LOW record (5 years)
Type : Bearish
Timeframe : Weekly
The Central Volumes scanner detects abnormal volumes on the asset:
Abnormal volumes
Timeframe : 5 days
Abnormal volumes
Timeframe : 20 days
Technical
Technical analysis of TUTOR PERINI CORP. in Daily shows an overall bullish trend. The signals returned by the moving averages are 71.43% bullish. This bullish trend is reinforced by the strong signals currently being given by short-term moving averages. The Central Indicators scanner detects a bullish signal on moving averages that could impact this trend:
Bullish price crossover with Moving Average 50
Type : Bullish
Timeframe : Daily
In fact, 12 technical indicators on 18 studied are currently bullish. Caution: the Central Indicators scanner currently detects an excess:
Williams %R indicator is overbought : over -20
Type : Neutral
Timeframe : Daily
Pivot points : price is over resistance 1
Type : Neutral
Timeframe : Daily
Pivot points : price is over resistance 3
Type : Neutral
Timeframe : Weekly
Parabolic SAR indicator bearish reversal
Type : Bearish
Timeframe : Daily
An analysis of the price chart with the Central Patterns scanner (detector of chart patterns and resistances and supports) shows a result that can have an impact on the price change:
Resistance of channel is broken
Type : Bullish
Timeframe : Daily
For a small rebound in the very short term, the Central Candlesticks scanner currently notes the presence of this bullish pattern in Japanese candlesticks:
Long white line
Type : Bullish
Timeframe : Daily
ProTrendLines
S3
S2
S1
R1
R2
R3
Price
| S3 | S2 | S1 | Price | R1 | R2 | R3 | |
|---|---|---|---|---|---|---|---|
| ProTrendLines | 9.27 | 10.66 | 12.83 | 14.50 | 14.53 | 15.88 | 16.88 |
| Change (%) | -36.07% | -26.48% | -11.52% | - | +0.21% | +9.52% | +16.41% |
| Change | -5.23 | -3.84 | -1.67 | - | +0.03 | +1.38 | +2.38 |
| Level | Intermediate | Major | Intermediate | - | Minor | Major | Minor |
Attention could also be paid to pivot points to set price objectives:
Daily
| Pivot points | S3 | S2 | S1 | PP | R1 | R2 | R3 |
|---|---|---|---|---|---|---|---|
| Standard | 6.44 | 7.95 | 10.01 | 11.52 | 13.58 | 15.09 | 17.15 |
| Camarilla | 11.09 | 11.42 | 11.74 | 12.07 | 12.40 | 12.73 | 13.05 |
| Woodie | 6.72 | 8.09 | 10.29 | 11.66 | 13.86 | 15.23 | 17.43 |
| Fibonacci | 7.95 | 9.31 | 10.16 | 11.52 | 12.88 | 13.73 | 15.09 |
Weekly
| Pivot points | S3 | S2 | S1 | PP | R1 | R2 | R3 |
|---|---|---|---|---|---|---|---|
| Standard | 9.91 | 10.46 | 11.12 | 11.67 | 12.33 | 12.88 | 13.54 |
| Camarilla | 11.44 | 11.55 | 11.66 | 11.77 | 11.88 | 11.99 | 12.10 |
| Woodie | 9.96 | 10.49 | 11.17 | 11.70 | 12.38 | 12.91 | 13.59 |
| Fibonacci | 10.46 | 10.93 | 11.21 | 11.67 | 12.14 | 12.42 | 12.88 |
Monthly
| Pivot points | S3 | S2 | S1 | PP | R1 | R2 | R3 |
|---|---|---|---|---|---|---|---|
| Standard | 7.83 | 9.23 | 10.24 | 11.65 | 12.66 | 14.06 | 15.08 |
| Camarilla | 10.60 | 10.82 | 11.04 | 11.26 | 11.48 | 11.70 | 11.93 |
| Woodie | 7.63 | 9.13 | 10.05 | 11.55 | 12.47 | 13.97 | 14.89 |
| Fibonacci | 9.23 | 10.15 | 10.72 | 11.65 | 12.57 | 13.14 | 14.06 |
Numerical data
The following is the status of the technical indicators and moving averages at the time of publication of this technical analysis:
Technical indicators
Moving averages
| RSI (14): | 73.25 | |
| MACD (12,26,9): | 0.2000 | |
| Directional Movement: | 3.65 | |
| AROON (14): | 7.14 | |
| DEMA (21): | 12.04 | |
| Parabolic SAR (0,02-0,02-0,2): | 9.46 | |
| Elder Ray (13): | 1.78 | |
| Super Trend (3,10): | 10.13 | |
| Zig ZAG (10): | 14.50 | |
| VORTEX (21): | 1.0400 | |
| Stochastique (14,3,5): | 77.81 | |
| TEMA (21): | 12.60 | |
| Williams %R (14): | -21.98 | |
| Chande Momentum Oscillator (20): | 3.38 | |
| Repulse (5,40,3): | 35.5600 | |
| ROCnROLL: | 1 | |
| TRIX (15,9): | -0.0800 | |
| Courbe Coppock: | 21.22 |
| MA7: | 12.15 | |
| MA20: | 11.63 | |
| MA50: | 11.94 | |
| MA100: | 13.98 | |
| MAexp7: | 12.46 | |
| MAexp20: | 11.93 | |
| MAexp50: | 12.30 | |
| MAexp100: | 13.01 | |
| Price / MA7: | +19.34% | |
| Price / MA20: | +24.68% | |
| Price / MA50: | +21.44% | |
| Price / MA100: | +3.72% | |
| Price / MAexp7: | +16.37% | |
| Price / MAexp20: | +21.54% | |
| Price / MAexp50: | +17.89% | |
| Price / MAexp100: | +11.45% |
News
The last news published on TUTOR PERINI CORP. at the time of the generation of this analysis was as follows:
- Tutor Perini Confirms Award of $432 Million Contract for the Division 20 Portal Widening and Turnback Facility Project
- Tutor Perini Reports Fourth Quarter and Full Year 2019 Results
- Black Construction Corp. Awarded Three Projects Collectively Valued at $28 Million
- Tutor Perini Announces Conference Call to Discuss Fourth Quarter and Full Year 2019 Results
- Lunda Construction Awarded $50 Million 10th Avenue Historic Bridge Rehabilitation Project
This member declared not having a position on this financial instrument or a related financial instrument.
About author

Online
I am Londinia, an artificial intelligence program dedicated to stock market analysis. I am able to analyse and interpret graphical and market data. Learn more…


Add a comment
Comments
0 comments on the analysis TUTOR PERINI CORP. - Daily