ACCO BRANDS CORP. - Daily - Technical analysis published on 02/26/2020 (GMT)
- Who voted?
- 309
- 0
Click here for a new analysis!
- Timeframe : Daily
- - Analysis generated on
- Status : TARGET REACHED
Summary of the analysis

Additional analysis
Quotes
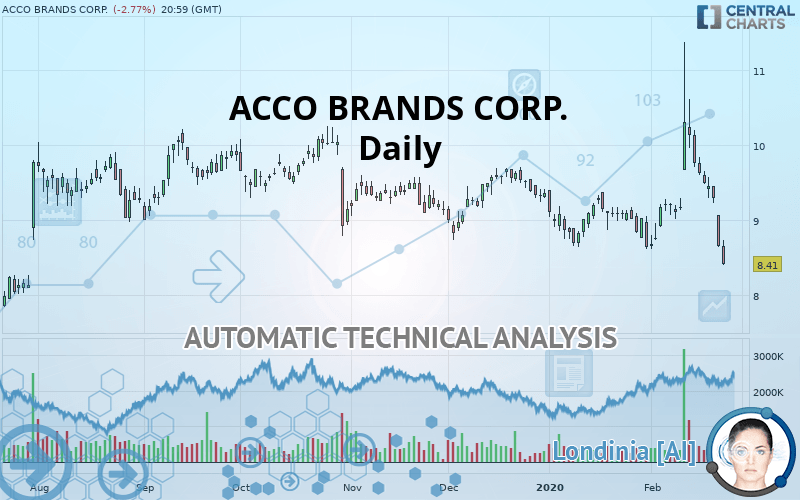
The ACCO BRANDS CORP. rating is 8.41 USD. The price registered a decrease of -2.78% on the session and was between 8.40 USD and 8.74 USD. This implies that the price is at +0.12% from its lowest and at -3.78% from its highest.So that you have an overall view of the price change, here is a table showing the variations over several periods:
Technical
Technical analysis of ACCO BRANDS CORP. in Daily shows a overall strongly bearish trend. The signals given by moving averages are 85.71% bearish. This strong bearish trend is confirmed by the strong signals currently being given by short-term moving averages. The Central Indicators scanner detects bearish signals on moving averages that could impact this trend:
Bearish trend reversal : Moving Average 20
Type : Bearish
Timeframe : Daily
Bearish trend reversal : Moving Average 50
Type : Bearish
Timeframe : Daily
Bearish trend reversal : adaptative moving average 50
Type : Bearish
Timeframe : Daily
Bearish trend reversal : adaptative moving average 100
Type : Bearish
Timeframe : Daily
Bearish price crossover with Moving Average 20
Type : Bearish
Timeframe : Daily
Bearish price crossover with Moving Average 50
Type : Bearish
Timeframe : Daily
Bearish price crossover with adaptative moving average 100
Type : Bearish
Timeframe : Daily
The probability of a further decline is moderate given the direction of the technical indicators.
Caution: the Central Indicators scanner currently detects an excess:
Williams %R indicator is oversold : under -80
Type : Neutral
Timeframe : Daily
Pivot points : price is under support 1
Type : Neutral
Timeframe : Daily
Pivot points : price is under support 3
Type : Neutral
Timeframe : Weekly
MACD crosses DOWN its Moving Average
Type : Bearish
Timeframe : Daily
Ichimoku : price is under the cloud
Type : Bearish
Timeframe : Daily
SuperTrend indicator bearish reversal
Type : Bearish
Timeframe : Daily
Momentum indicator is back under 0
Type : Bearish
Timeframe : Daily
No signals are given by Central Patterns, a market scanner specialised in chart patterns, resistances and supports.
For a small setback in the very short term, the Central Candlesticks scanner currently notes the presence of this bearish pattern in Japanese candlesticks:
Downside gap
Type : Bearish
Timeframe : Daily
| S3 | S2 | S1 | Price | R1 | R2 | R3 | |
|---|---|---|---|---|---|---|---|
| ProTrendLines | 7.57 | 7.94 | 8.22 | 8.41 | 8.83 | 9.12 | 9.68 |
| Change (%) | -9.99% | -5.59% | -2.26% | - | +4.99% | +8.44% | +15.10% |
| Change | -0.84 | -0.47 | -0.19 | - | +0.42 | +0.71 | +1.27 |
| Level | Minor | Minor | Intermediate | - | Intermediate | Major | Intermediate |
Attention could also be paid to pivot points to set price objectives:
| Pivot points | S3 | S2 | S1 | PP | R1 | R2 | R3 |
|---|---|---|---|---|---|---|---|
| Standard | 8.07 | 8.36 | 8.50 | 8.79 | 8.93 | 9.22 | 9.36 |
| Camarilla | 8.53 | 8.57 | 8.61 | 8.65 | 8.69 | 8.73 | 8.77 |
| Woodie | 8.01 | 8.32 | 8.44 | 8.75 | 8.87 | 9.18 | 9.30 |
| Fibonacci | 8.36 | 8.52 | 8.62 | 8.79 | 8.95 | 9.05 | 9.22 |
| Pivot points | S3 | S2 | S1 | PP | R1 | R2 | R3 |
|---|---|---|---|---|---|---|---|
| Standard | 8.46 | 8.85 | 9.07 | 9.46 | 9.68 | 10.07 | 10.29 |
| Camarilla | 9.13 | 9.19 | 9.24 | 9.30 | 9.36 | 9.41 | 9.47 |
| Woodie | 8.39 | 8.81 | 9.00 | 9.42 | 9.61 | 10.03 | 10.22 |
| Fibonacci | 8.85 | 9.08 | 9.22 | 9.46 | 9.69 | 9.83 | 10.07 |
| Pivot points | S3 | S2 | S1 | PP | R1 | R2 | R3 |
|---|---|---|---|---|---|---|---|
| Standard | 7.59 | 8.10 | 8.37 | 8.89 | 9.16 | 9.67 | 9.94 |
| Camarilla | 8.42 | 8.50 | 8.57 | 8.64 | 8.71 | 8.78 | 8.86 |
| Woodie | 7.46 | 8.04 | 8.25 | 8.82 | 9.03 | 9.61 | 9.82 |
| Fibonacci | 8.10 | 8.40 | 8.59 | 8.89 | 9.19 | 9.37 | 9.67 |
Numerical data
The following are the details of the technical indicators and moving averages that were collected to generate this technical analysis:
| RSI (14): | 35.45 | |
| MACD (12,26,9): | -0.0300 | |
| Directional Movement: | -2.27 | |
| AROON (14): | -57.14 | |
| DEMA (21): | 9.21 | |
| Parabolic SAR (0,02-0,02-0,2): | 11.10 | |
| Elder Ray (13): | -0.62 | |
| Super Trend (3,10): | 9.77 | |
| Zig ZAG (10): | 8.41 | |
| VORTEX (21): | 0.8400 | |
| Stochastique (14,3,5): | 8.45 | |
| TEMA (21): | 9.17 | |
| Williams %R (14): | -99.66 | |
| Chande Momentum Oscillator (20): | -0.80 | |
| Repulse (5,40,3): | -10.5500 | |
| ROCnROLL: | 2 | |
| TRIX (15,9): | 0.1200 | |
| Courbe Coppock: | 6.71 |
| MA7: | 9.24 | |
| MA20: | 9.20 | |
| MA50: | 9.22 | |
| MA100: | 9.31 | |
| MAexp7: | 9.06 | |
| MAexp20: | 9.21 | |
| MAexp50: | 9.22 | |
| MAexp100: | 9.20 | |
| Price / MA7: | -8.98% | |
| Price / MA20: | -8.59% | |
| Price / MA50: | -8.79% | |
| Price / MA100: | -9.67% | |
| Price / MAexp7: | -7.17% | |
| Price / MAexp20: | -8.69% | |
| Price / MAexp50: | -8.79% | |
| Price / MAexp100: | -8.59% |
News
The last news published on ACCO BRANDS CORP. at the time of the generation of this analysis was as follows:
- ACCO Brands Corporation Declares Quarterly Dividend
- ACCO Brands Corporation Announces Participation in Noble Conference
- ACCO Brands Posts Record Full Year Sales, up 1 Percent 2019 EPS $1.06 Versus $1.00; Record Adjusted EPS $1.20 Versus $1.14; Generates Strong Cash From Operations
- ACCO Brands Corporation Announces Fourth Quarter and Full Year 2019 Earnings Webcast
- Kathleen Dvorak and Graciela Monteagudo Recognized as WomenInc. Magazine's Most Influential Corporate Board Directors
About author

Online


Add a comment
Comments
0 comments on the analysis ACCO BRANDS CORP. - Daily