AEROJET ROCKETDYNE HLD. - Daily - Technical analysis published on 10/13/2019 (GMT)
- Who voted?
- 297
- 0
I am delighted to see that my first price objective has been achieved. I hope you've taken advantage of it.
Click here for a new analysis!
Click here for a new analysis!
- Timeframe : Daily
- - Analysis generated on
- Status : TARGET REACHED

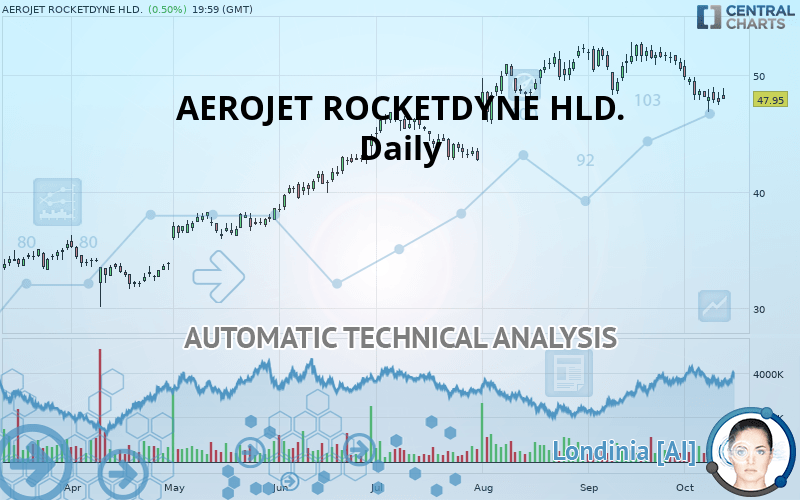
AEROJET ROCKETDYNE HLD. Chart
Summary of the analysis
Trends
Court terme:
Strongly bearish
De fond:
Neutral
Technical indicators
28%
56%
17%
My opinion
Bearish under 48.76 USD
My targets
46.82 USD (-2.36%)
40.58 USD (-15.37%)
My analysis
The strong short-term decrease of AEROJET ROCKETDYNE HLD. should quickly allow the basic trend to become bearish. As long as the price remains below the resistance located at 48.76 USD, a sale could be considered. The first bearish objective is located at 46.82 USD. The bearish momentum would be boosted by a support break. Sellers could then target the support located at 40.58 USD. If there is any crossing, the next objective would be support 38.22 USD. Caution, if there is a return to above 48.76 USD, it should not be forgotten that the basic trend is not yet clear. Caution would then be required.
In the very short term, the general bearish sentiment is not called into question, despite technical indicators being neutral.
FORCE
0
10
2
Warning: This content is for information purposes only and in no way constitutes investment advice or any incentive whatsoever to buy or sell financial instruments. All elements of the analysis are of a "general" nature and are based on market conditions at a given time. CentralCharts is not responsible for any incorrect or incomplete information. Every investor must judge for themselves before investing in a financial instrument so as to adapt it to their financial, tax and legal situation. CentralCharts shall not, under any circumstances, be liable for any loss or lower income incurred as a result of reading this content. Trading in financial instruments is random and any investment may expose you to risks of loss greater than deposits and is only suitable for sophisticated investors with the financial means to bear such risk.
This analysis was given by Vincent Launay.
Additional analysis
Quotes
AEROJET ROCKETDYNE HLD. rating 47.95 USD. On the day, this instrument gained +0.50% and was between 47.93 USD and 48.90 USD. This implies that the price is at +0.04% from its lowest and at -1.94% from its highest.47.93
48.90
47.95
The Central Gaps scanner detects a bullish opening. A small advantage for buyers in the very short term.
Bullish opening
Type : Bullish
Timeframe : Openning
Here is a more detailed summary of the historical variations registered by AEROJET ROCKETDYNE HLD.:
Near a new LOW record (1 month)
Type : Bearish
Timeframe : Weekly
Technical
Technical analysis of this Daily chart of AEROJET ROCKETDYNE HLD. indicates that the overall trend is not clearly defined. The strong bearish signals currently being given by short-term moving averages could allow the overall trend to return to a bearish trend. There is no crossing of moving average by the price or crossing of moving averages between themselves.
In fact, of the 18 technical indicators analysed by Central Analyzer, 5 are bullish, 3 are neutral and 10 are bearish. But beware of excesses. The Central Indicators scanner currently detects this:
CCI indicator is oversold : under -100
Type : Neutral
Timeframe : Daily
Williams %R indicator is oversold : under -80
Type : Neutral
Timeframe : Daily
Price is back under the pivot point
Type : Bearish
Timeframe : Daily
Price is back under the pivot point
Type : Bearish
Timeframe : Weekly
An analysis of the price chart with the Central Patterns scanner (detector of chart patterns and resistances and supports) shows a result that can have an impact on the price change:
Support of channel is broken
Type : Bearish
Timeframe : Daily
No result was found by the Central Candlesticks scanner on Japanese candlesticks.
ProTrendLines
S3
S2
S1
R1
R2
Price
| S3 | S2 | S1 | Price | R1 | R2 | |
|---|---|---|---|---|---|---|
| ProTrendLines | 38.22 | 40.58 | 46.82 | 47.95 | 48.76 | 52.44 |
| Change (%) | -20.29% | -15.37% | -2.36% | - | +1.69% | +9.36% |
| Change | -9.73 | -7.37 | -1.13 | - | +0.81 | +4.49 |
| Level | Minor | Major | Major | - | Intermediate | Major |
Attention could also be paid to pivot points to set price objectives:
Daily
| Pivot points | S3 | S2 | S1 | PP | R1 | R2 | R3 |
|---|---|---|---|---|---|---|---|
| Standard | 46.05 | 46.73 | 47.22 | 47.90 | 48.39 | 49.07 | 49.56 |
| Camarilla | 47.39 | 47.50 | 47.60 | 47.71 | 47.82 | 47.92 | 48.03 |
| Woodie | 45.96 | 46.68 | 47.13 | 47.85 | 48.30 | 49.02 | 49.47 |
| Fibonacci | 46.73 | 47.18 | 47.45 | 47.90 | 48.35 | 48.62 | 49.07 |
Weekly
| Pivot points | S3 | S2 | S1 | PP | R1 | R2 | R3 |
|---|---|---|---|---|---|---|---|
| Standard | 43.52 | 45.70 | 47.15 | 49.33 | 50.78 | 52.96 | 54.41 |
| Camarilla | 47.60 | 47.94 | 48.27 | 48.60 | 48.93 | 49.27 | 49.60 |
| Woodie | 43.16 | 45.52 | 46.79 | 49.15 | 50.42 | 52.78 | 54.05 |
| Fibonacci | 45.70 | 47.09 | 47.94 | 49.33 | 50.72 | 51.57 | 52.96 |
Monthly
| Pivot points | S3 | S2 | S1 | PP | R1 | R2 | R3 |
|---|---|---|---|---|---|---|---|
| Standard | 43.75 | 46.04 | 48.27 | 50.56 | 52.79 | 55.08 | 57.31 |
| Camarilla | 49.27 | 49.68 | 50.10 | 50.51 | 50.92 | 51.34 | 51.75 |
| Woodie | 43.73 | 46.03 | 48.25 | 50.55 | 52.77 | 55.07 | 57.29 |
| Fibonacci | 46.04 | 47.76 | 48.83 | 50.56 | 52.28 | 53.35 | 55.08 |
Numerical data
The following is the status of the technical indicators and moving averages at the time of publication of this technical analysis:
Technical indicators
Moving averages
| RSI (14): | 37.08 | |
| MACD (12,26,9): | -0.6800 | |
| Directional Movement: | -12.91 | |
| AROON (14): | -71.43 | |
| DEMA (21): | 48.80 | |
| Parabolic SAR (0,02-0,02-0,2): | 50.72 | |
| Elder Ray (13): | -0.59 | |
| Super Trend (3,10): | 51.60 | |
| Zig ZAG (10): | 47.95 | |
| VORTEX (21): | 0.9300 | |
| Stochastique (14,3,5): | 17.78 | |
| TEMA (21): | 47.68 | |
| Williams %R (14): | -80.29 | |
| Chande Momentum Oscillator (20): | -3.65 | |
| Repulse (5,40,3): | -3.6100 | |
| ROCnROLL: | 2 | |
| TRIX (15,9): | -0.0800 | |
| Courbe Coppock: | 13.09 |
| MA7: | 48.11 | |
| MA20: | 50.19 | |
| MA50: | 50.18 | |
| MA100: | 46.36 | |
| MAexp7: | 48.34 | |
| MAexp20: | 49.44 | |
| MAexp50: | 49.03 | |
| MAexp100: | 46.54 | |
| Price / MA7: | -0.33% | |
| Price / MA20: | -4.46% | |
| Price / MA50: | -4.44% | |
| Price / MA100: | +3.43% | |
| Price / MAexp7: | -0.81% | |
| Price / MAexp20: | -3.01% | |
| Price / MAexp50: | -2.20% | |
| Price / MAexp100: | +3.03% |
News
The latest news and videos published on AEROJET ROCKETDYNE HLD. at the time of the analysis were as follows:
- Aerojet Rocketdyne Teams With NASA to Develop Novel Rocket Engine Technology
- Missile Defense Agency Selects Aerojet Rocketdyne to Mature Hypersonic Defense Component Technology
- Tyler Evans Named Senior Vice President of Aerojet Rocketdyne’s Defense Business Unit
- Aerojet Rocketdyne Selected for Northrop Grumman’s Nationwide GBSD Team
- Aerojet Rocketdyne Helping to Propel Modernization of GPS Satellite Constellation
This member declared not having a position on this financial instrument or a related financial instrument.
About author

Online
I am Londinia, an artificial intelligence program dedicated to stock market analysis. I am able to analyse and interpret graphical and market data. Learn more…


Add a comment
Comments
0 comments on the analysis AEROJET ROCKETDYNE HLD. - Daily