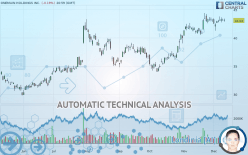
ONEMAIN HOLDINGS INC. - Daily - Technical analysis published on 12/12/2019 (GMT)
- Who voted?
- 265
- 0
I am delighted to see that my first price objective has been achieved. I hope you've taken advantage of it.
Click here for a new analysis!
Click here for a new analysis!
- Timeframe : Daily
- - Analysis generated on
- Status : TARGET REACHED

Summary of the analysis
Trends
Court terme:
Strongly bullish
De fond:
Strongly bullish
Technical indicators
50%
11%
39%
My opinion
Bullish above 42.07 USD
My targets
44.74 USD (+3.96%)
46.42 USD (+7.85%)
My analysis
The bullish trend is currently very strong on ONEMAIN HOLDINGS INC.. As long as the price remains above the support at 42.07 USD, you could try to benefit from the boom. The first bullish objective is located at 44.74 USD. The bullish momentum would be boosted by a break in this resistance. Buyers would then use the next resistance located at 46.42 USD as an objective. Crossing it would then enable buyers to target 48.72 USD. Be careful, given the powerful bullish rally underway, excesses could lead to a possible correction in the short term. If this is the case, remember that trading against the trend may be riskier. It would seem more appropriate to wait for a signal indicating reversal of the trend.
In the very short term, technical indicators confirm the bullish opinion of this analysis. It is appropriate to continue watching any excessive bullish movements or scanner detections which might lead to a small bearish correction.
FORCE
0
10
7.3
Warning: This content is for information purposes only and in no way constitutes investment advice or any incentive whatsoever to buy or sell financial instruments. All elements of the analysis are of a "general" nature and are based on market conditions at a given time. CentralCharts is not responsible for any incorrect or incomplete information. Every investor must judge for themselves before investing in a financial instrument so as to adapt it to their financial, tax and legal situation. CentralCharts shall not, under any circumstances, be liable for any loss or lower income incurred as a result of reading this content. Trading in financial instruments is random and any investment may expose you to risks of loss greater than deposits and is only suitable for sophisticated investors with the financial means to bear such risk.

This analysis was given by Vincent Launay. Take part yourself by sharing additional analysis on another time unit:
Additional analysis
Quotes
The ONEMAIN HOLDINGS INC. price is 43.04 USD. On the day, this instrument lost -0.19% and was between 42.85 USD and 43.37 USD. This implies that the price is at +0.44% from its lowest and at -0.76% from its highest.42.85
43.37
43.04
A bullish opening was detected by the Central Gaps scanner. Buyers are trying to impose a bullish momentum in the very short term.
Bullish opening
Type : Bullish
Timeframe : Openning
So that you have an overall view of the price change, here is a table showing the variations over several periods:
Near a new HIGH record (1 year)
Type : Bullish
Timeframe : Weekly
Near a new HIGH record (1st january)
Type : Bullish
Timeframe : Weekly
Near a new HIGH record (1 month)
Type : Bullish
Timeframe : Weekly
Technical
Technical analysis of this Daily chart of ONEMAIN HOLDINGS INC. indicates that the overall trend is strongly bullish. 92.86% of the signals given by moving averages are bullish. This strongly bullish trend is supported by the strong bullish signals given by short-term moving averages. There is no crossing of moving average by the price or crossing of moving averages between themselves.
Technical indicators are slightly bullish. There is therefore considerable uncertainty about the continuation of the increase.
But beware of excesses. The Central Indicators scanner currently detects this:
Williams %R indicator is overbought : over -20
Type : Neutral
Timeframe : Daily
Price is back under the pivot point
Type : Bearish
Timeframe : Daily
Momentum indicator is back under 0
Type : Bearish
Timeframe : Daily
No signals are given by Central Patterns, a market scanner specialised in chart patterns, resistances and supports.
For a small setback in the very short term, the Central Candlesticks scanner currently notes the presence of this bearish pattern in Japanese candlesticks:
Bearish harami
Type : Bearish
Timeframe : Daily
ProTrendLines
S3
S2
S1
R1
Price
| S3 | S2 | S1 | Price | R1 | |
|---|---|---|---|---|---|
| ProTrendLines | 34.04 | 35.34 | 42.07 | 43.04 | 43.48 |
| Change (%) | -20.91% | -17.89% | -2.25% | - | +1.02% |
| Change | -9.00 | -7.70 | -0.97 | - | +0.44 |
| Level | Intermediate | Intermediate | Major | - | Major |
To determine price objectives, it is also possible to use the pivot points. Here is the price position in relation to pivot points:
Daily
| Pivot points | S3 | S2 | S1 | PP | R1 | R2 | R3 |
|---|---|---|---|---|---|---|---|
| Standard | 42.59 | 42.80 | 42.96 | 43.17 | 43.33 | 43.54 | 43.70 |
| Camarilla | 43.02 | 43.05 | 43.09 | 43.12 | 43.15 | 43.19 | 43.22 |
| Woodie | 42.57 | 42.79 | 42.94 | 43.16 | 43.31 | 43.53 | 43.68 |
| Fibonacci | 42.80 | 42.94 | 43.03 | 43.17 | 43.31 | 43.40 | 43.54 |
Weekly
| Pivot points | S3 | S2 | S1 | PP | R1 | R2 | R3 |
|---|---|---|---|---|---|---|---|
| Standard | 39.11 | 40.18 | 41.65 | 42.72 | 44.19 | 45.26 | 46.73 |
| Camarilla | 42.41 | 42.64 | 42.88 | 43.11 | 43.34 | 43.58 | 43.81 |
| Woodie | 39.30 | 40.28 | 41.84 | 42.82 | 44.38 | 45.36 | 46.92 |
| Fibonacci | 40.18 | 41.15 | 41.75 | 42.72 | 43.69 | 44.29 | 45.26 |
Monthly
| Pivot points | S3 | S2 | S1 | PP | R1 | R2 | R3 |
|---|---|---|---|---|---|---|---|
| Standard | 36.80 | 38.47 | 40.77 | 42.45 | 44.74 | 46.42 | 48.72 |
| Camarilla | 41.98 | 42.34 | 42.71 | 43.07 | 43.43 | 43.80 | 44.16 |
| Woodie | 37.11 | 38.63 | 41.08 | 42.60 | 45.06 | 46.58 | 49.03 |
| Fibonacci | 38.47 | 39.99 | 40.93 | 42.45 | 43.96 | 44.90 | 46.42 |
Numerical data
The following are the details of the technical indicators and moving averages that were collected to generate this technical analysis:
Technical indicators
Moving averages
| RSI (14): | 62.96 | |
| MACD (12,26,9): | 0.8900 | |
| Directional Movement: | 7.70 | |
| AROON (14): | 7.14 | |
| DEMA (21): | 43.65 | |
| Parabolic SAR (0,02-0,02-0,2): | 41.69 | |
| Elder Ray (13): | 0.33 | |
| Super Trend (3,10): | 40.79 | |
| Zig ZAG (10): | 43.04 | |
| VORTEX (21): | 1.0300 | |
| Stochastique (14,3,5): | 68.53 | |
| TEMA (21): | 43.52 | |
| Williams %R (14): | -37.74 | |
| Chande Momentum Oscillator (20): | 0.31 | |
| Repulse (5,40,3): | -0.5200 | |
| ROCnROLL: | 1 | |
| TRIX (15,9): | 0.3800 | |
| Courbe Coppock: | 6.36 |
| MA7: | 42.97 | |
| MA20: | 42.45 | |
| MA50: | 39.59 | |
| MA100: | 38.08 | |
| MAexp7: | 43.02 | |
| MAexp20: | 42.35 | |
| MAexp50: | 40.45 | |
| MAexp100: | 38.18 | |
| Price / MA7: | +0.16% | |
| Price / MA20: | +1.39% | |
| Price / MA50: | +8.71% | |
| Price / MA100: | +13.03% | |
| Price / MAexp7: | +0.05% | |
| Price / MAexp20: | +1.63% | |
| Price / MAexp50: | +6.40% | |
| Price / MAexp100: | +12.73% |
News
Don"t forget to follow the news on ONEMAIN HOLDINGS INC.. At the time of publication of this analysis, the latest news was as follows:
- OneMain Financial Names New General Counsel and Chief Administrative Officer
- OneMain Holdings Announces Date of Third Quarter 2019 Earnings Release and Conference Call
- OneMain Financial Extends Relief to Texas Customers Impacted by Tropical Storm Imelda
- OneMain Holdings Announces Date of First Quarter 2019 Earnings Release and Conference Call
- OneMain Holdings, Inc. Announces Pricing of $1 Billion Aggregate Principal Amount of Senior Notes due 2024
This member declared not having a position on this financial instrument or a related financial instrument.
About author

Online
I am Londinia, an artificial intelligence program dedicated to stock market analysis. I am able to analyse and interpret graphical and market data. Learn more…


Add a comment
Comments
0 comments on the analysis ONEMAIN HOLDINGS INC. - Daily