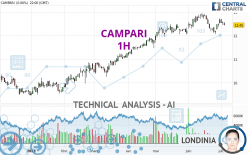
CAMPARI - 1H - Technical analysis published on 07/06/2023 (GMT)
- 147
- 0
Click here for a new analysis!
- Timeframe : 1H
- - Analysis generated on
- Status : INVALID

Summary of the analysis

Additional analysis
Quotes
The CAMPARI price is 12.410 EUR. The price registered a decrease of -0.32% on the session and was traded between 12.320 EUR and 12.570 EUR over the period. The price is currently at +0.73% from its lowest and -1.27% from its highest.The Central Gaps scanner detects a bearish gap which is a sign that the sellers have taken the lead in the very short term.
Opening Gap DOWN
Type : Bearish
Timeframe : Openning
A study of price movements over other periods shows the following variations:
Near a new HIGH record (1 year)
Type : Bullish
Timeframe : Weekly
Near a new HIGH record (1st january)
Type : Bullish
Timeframe : Weekly
Near a new HIGH record (1 month)
Type : Bullish
Timeframe : Weekly
Technical
Technical analysis of CAMPARI in 1H shows an overall bearish trend. 67.86% of the signals given by moving averages are bearish. This bearish trend is supported by the strong bearish signals given by short-term moving averages. The Central Indicators scanner detects bearish signals on moving averages that could impact this trend:
Bearish price crossover with Moving Average 100
Type : Bearish
Timeframe : 1 hour
Bearish price crossover with adaptative moving average 100
Type : Bearish
Timeframe : 1 hour
In fact, of the 18 technical indicators analysed by Central Analyzer, 4 are bullish, 5 are neutral and 9 are bearish. But beware of excesses. The Central Indicators scanner currently detects this:
CCI indicator is oversold : under -100
Type : Neutral
Timeframe : 1 hour
Williams %R indicator is oversold : under -80
Type : Neutral
Timeframe : 1 hour
Pivot points : price is under support 1
Type : Neutral
Timeframe : 1 hour
Aroon indicator bullish trend
Type : Bullish
Timeframe : 1 hour
Ichimoku : price is under the cloud
Type : Bearish
Timeframe : 1 hour
Price is back under the pivot point
Type : Bearish
Timeframe : Weekly
Momentum indicator is back under 0
Type : Bearish
Timeframe : 1 hour
The analysis of the price chart with Central Patterns scanners does not return any result.
The Central Candlesticks scanner which studies Japanese candlesticks did not detect anything.
| S3 | S2 | S1 | Price | R1 | R2 | R3 | |
|---|---|---|---|---|---|---|---|
| ProTrendLines | 12.070 | 12.215 | 12.360 | 12.410 | 12.445 | 12.614 | 12.724 |
| Change (%) | -2.74% | -1.57% | -0.40% | - | +0.28% | +1.64% | +2.53% |
| Change | -0.340 | -0.195 | -0.050 | - | +0.035 | +0.204 | +0.314 |
| Level | Major | Major | Minor | - | Minor | Minor | Major |
Pivot points can also be used to set your price objectives. Here is the price situation in relation to pivot points:
| Pivot points | S3 | S2 | S1 | PP | R1 | R2 | R3 |
|---|---|---|---|---|---|---|---|
| Standard | 12.252 | 12.343 | 12.397 | 12.488 | 12.542 | 12.633 | 12.687 |
| Camarilla | 12.410 | 12.423 | 12.437 | 12.450 | 12.463 | 12.477 | 12.490 |
| Woodie | 12.233 | 12.334 | 12.378 | 12.479 | 12.523 | 12.624 | 12.668 |
| Fibonacci | 12.343 | 12.399 | 12.433 | 12.488 | 12.544 | 12.578 | 12.633 |
| Pivot points | S3 | S2 | S1 | PP | R1 | R2 | R3 |
|---|---|---|---|---|---|---|---|
| Standard | 11.610 | 11.840 | 12.265 | 12.495 | 12.920 | 13.150 | 13.575 |
| Camarilla | 12.510 | 12.570 | 12.630 | 12.690 | 12.750 | 12.810 | 12.870 |
| Woodie | 11.708 | 11.889 | 12.363 | 12.544 | 13.018 | 13.199 | 13.673 |
| Fibonacci | 11.840 | 12.090 | 12.245 | 12.495 | 12.745 | 12.900 | 13.150 |
| Pivot points | S3 | S2 | S1 | PP | R1 | R2 | R3 |
|---|---|---|---|---|---|---|---|
| Standard | 11.297 | 11.683 | 12.187 | 12.573 | 13.077 | 13.463 | 13.967 |
| Camarilla | 12.445 | 12.527 | 12.608 | 12.690 | 12.772 | 12.853 | 12.935 |
| Woodie | 11.355 | 11.713 | 12.245 | 12.603 | 13.135 | 13.493 | 14.025 |
| Fibonacci | 11.683 | 12.023 | 12.233 | 12.573 | 12.913 | 13.123 | 13.463 |
Numerical data
The following is the status of the technical indicators and moving averages at the time of publication of this technical analysis:
| RSI (14): | 35.59 | |
| MACD (12,26,9): | -0.0280 | |
| Directional Movement: | -9.747 | |
| AROON (14): | 28.571 | |
| DEMA (21): | 12.447 | |
| Parabolic SAR (0,02-0,02-0,2): | 12.347 | |
| Elder Ray (13): | -0.054 | |
| Super Trend (3,10): | 12.543 | |
| Zig ZAG (10): | 12.365 | |
| VORTEX (21): | 0.8700 | |
| Stochastique (14,3,5): | 47.10 | |
| TEMA (21): | 12.417 | |
| Williams %R (14): | -84.00 | |
| Chande Momentum Oscillator (20): | -0.130 | |
| Repulse (5,40,3): | -1.2440 | |
| ROCnROLL: | 2 | |
| TRIX (15,9): | -0.0280 | |
| Courbe Coppock: | 1.13 |
| MA7: | 12.513 | |
| MA20: | 12.549 | |
| MA50: | 12.380 | |
| MA100: | 11.693 | |
| MAexp7: | 12.445 | |
| MAexp20: | 12.479 | |
| MAexp50: | 12.493 | |
| MAexp100: | 12.488 | |
| Price / MA7: | -0.82% | |
| Price / MA20: | -1.11% | |
| Price / MA50: | +0.24% | |
| Price / MA100: | +6.13% | |
| Price / MAexp7: | -0.28% | |
| Price / MAexp20: | -0.55% | |
| Price / MAexp50: | -0.66% | |
| Price / MAexp100: | -0.62% |
News
Don't forget to follow the news on CAMPARI. At the time of publication of this analysis, the latest news was as follows:
- Campari hosts a night of unforgettable moments at 76th Festival de Cannes
- Campari® Poised to Bring Great Stories to Life Through 75th Festival de Cannes
- Acclaimed Master Distiller Jesus Susunaga Acosta Named New Maestro Tequilero at Casa San Nicolás
- Moët Hennessy and Campari Group to partner in a 50/50 joint venture to create a premium pan-European Wines & Spirits e-commerce player through Tannico
- Moët Hennessy and Campari Group to partner in a 50/50 joint venture to create a premium pan-European Wines & Spirits e-commerce player through Tannico
About author
Online


Add a comment
Comments
0 comments on the analysis CAMPARI - 1H