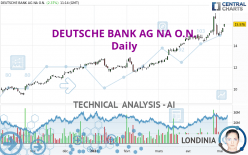
DEUTSCHE BANK AG NA O.N. - Daily - Technical analysis published on 05/07/2024 (GMT)
- 77
- 0
- Timeframe : Daily
- - Analysis generated on
- Status : IN PROGRESS...

Only Londinia subscribers can view the key levels of this analysis. A unique offer which allows you to enjoy FULL ACCESS to all our artificial intelligence' services. Discover Londinia...
Summary of the analysis
Trends
Short term:
Strongly bullish
Underlying:
Strongly bullish
Technical indicators
56%
11%
33%
My opinion
Bullish above
My targets
()
()
My analysis
All elements being clearly bullish, it would be possible for traders to trade only long positions (at the time of purchase) on DEUTSCHE BANK AG NA O.N. as long as the price remains well above . The buyers' bullish objective is set at . A bullish break in this resistance would boost the bullish momentum. The buyers could then target the resistance located at . If there is any crossing, the next objective would be the resistance located at . However, beware of bullish excesses that could lead to a possible short-term correction; but this possible correction would not be tradeable.
In the very short term, the general bullish sentiment is confirmed by technical indicators. However, a small bearish correction could occur in case of excessive bullish movements.
Force
0
10
7.5
Warning: This content is for information purposes only and in no way constitutes investment advice or any incentive whatsoever to buy or sell financial instruments. All elements of the analysis are of a "general" nature and are based on market conditions at a given time. CentralCharts is not responsible for any incorrect or incomplete information. Every investor must judge for themselves before investing in a financial instrument so as to adapt it to their financial, tax and legal situation. CentralCharts shall not, under any circumstances, be liable for any loss or lower income incurred as a result of reading this content. Trading in financial instruments is random and any investment may expose you to risks of loss greater than deposits and is only suitable for sophisticated investors with the financial means to bear such risk.

This analysis was given by Londinia. Take part yourself by sharing additional analysis on another time unit:
Additional analysis
Quotes
The DEUTSCHE BANK AG NA O.N. rating is 15.976 EUR. The price has increased by +2.37% since the last closing with the lowest point at 15.750 EUR and the highest point at 16.026 EUR. The deviation from the price is +1.43% for the low point and -0.31% for the high point.15.750
16.026
15.976
A bullish gap was detected at the opening by the Central Gaps scanner. There are a lot of buyers and they have the upper hand in the very short term.
Opening Gap UP
Type : Bullish
Timeframe : Openning
So that you have an overall view of the price change, here is a table showing the variations over several periods:
Technical
Technical analysis of this Daily chart of DEUTSCHE BANK AG NA O.N. indicates that the overall trend is strongly bullish. 92.86% of the signals given by moving averages are bullish. This strongly bullish trend is supported by the strong bullish signals given by short-term moving averages. The Central Indicators scanner detects a bearish signal on moving averages that could impact this trend:
Moving Average bearish crossovers : AMA20 & AMA50
Type : Bearish
Timeframe : Daily
An assessment of technical indicators shows a moderate bullish signal.
Caution: the Central Indicators scanner currently detects an excess:
CCI indicator is overbought : over 100
Type : Neutral
Timeframe : Daily
Pivot points : price is over resistance 1
Type : Neutral
Timeframe : Weekly
Pivot points : price is over resistance 2
Type : Neutral
Timeframe : Daily
Williams %R indicator is back over -50
Type : Bullish
Timeframe : Daily
Central Patterns, the scanner specializing in chart patterns, did not identify any signals.
The presence of a bullish Japanese candlestick pattern detected by Central Candlesticks that could cause a very short term rebound was also detected:
Upside gap
Type : Bullish
Timeframe : Daily
ProTrendLines
S3
S2
S1
R1
R2
R3
Price
| S3 | S2 | S1 | Price | R1 | R2 | R3 | |
|---|---|---|---|---|---|---|---|
| ProTrendLines | 12.801 | 13.719 | 15.468 | 15.976 | 16.660 | 30.100 | 38.269 |
| Change (%) | -19.87% | -14.13% | -3.18% | - | +4.28% | +88.41% | +139.54% |
| Change | -3.175 | -2.257 | -0.508 | - | +0.684 | +14.124 | +22.293 |
| Level | Intermediate | Intermediate | Major | - | Major | Major | Intermediate |
Attention could also be paid to pivot points to set price objectives:
Daily
| Pivot points | S3 | S2 | S1 | PP | R1 | R2 | R3 |
|---|---|---|---|---|---|---|---|
| Standard | 14.943 | 15.091 | 15.349 | 15.497 | 15.755 | 15.903 | 16.161 |
| Camarilla | 15.494 | 15.532 | 15.569 | 15.606 | 15.643 | 15.680 | 15.718 |
| Woodie | 14.997 | 15.119 | 15.403 | 15.525 | 15.809 | 15.931 | 16.215 |
| Fibonacci | 15.091 | 15.246 | 15.342 | 15.497 | 15.652 | 15.748 | 15.903 |
Weekly
| Pivot points | S3 | S2 | S1 | PP | R1 | R2 | R3 |
|---|---|---|---|---|---|---|---|
| Standard | 13.629 | 14.265 | 14.761 | 15.397 | 15.893 | 16.529 | 17.025 |
| Camarilla | 14.947 | 15.051 | 15.154 | 15.258 | 15.362 | 15.466 | 15.569 |
| Woodie | 13.560 | 14.230 | 14.692 | 15.362 | 15.824 | 16.494 | 16.956 |
| Fibonacci | 14.265 | 14.697 | 14.964 | 15.397 | 15.829 | 16.096 | 16.529 |
Monthly
| Pivot points | S3 | S2 | S1 | PP | R1 | R2 | R3 |
|---|---|---|---|---|---|---|---|
| Standard | 11.245 | 12.799 | 13.905 | 15.459 | 16.565 | 18.119 | 19.225 |
| Camarilla | 14.279 | 14.522 | 14.766 | 15.010 | 15.254 | 15.498 | 15.742 |
| Woodie | 11.020 | 12.687 | 13.680 | 15.347 | 16.340 | 18.007 | 19.000 |
| Fibonacci | 12.799 | 13.816 | 14.443 | 15.459 | 16.476 | 17.103 | 18.119 |
Numerical data
The following is the status of technical indicators and moving averages registered at the time this technical analysis was created:
Technical indicators
Moving averages
| RSI (14): | 63.08 | |
| MACD (12,26,9): | 0.4040 | |
| Directional Movement: | 17.590 | |
| AROON (14): | 57.143 | |
| DEMA (21): | 15.759 | |
| Parabolic SAR (0,02-0,02-0,2): | 16.696 | |
| Elder Ray (13): | 0.488 | |
| Super Trend (3,10): | 16.668 | |
| Zig ZAG (10): | 15.994 | |
| VORTEX (21): | 1.1250 | |
| Stochastique (14,3,5): | 47.19 | |
| TEMA (21): | 15.723 | |
| Williams %R (14): | -39.71 | |
| Chande Momentum Oscillator (20): | 1.176 | |
| Repulse (5,40,3): | 3.0230 | |
| ROCnROLL: | 1 | |
| TRIX (15,9): | 0.4330 | |
| Courbe Coppock: | 11.50 |
| MA7: | 15.503 | |
| MA20: | 15.174 | |
| MA50: | 14.185 | |
| MA100: | 13.158 | |
| MAexp7: | 15.536 | |
| MAexp20: | 15.194 | |
| MAexp50: | 14.355 | |
| MAexp100: | 13.382 | |
| Price / MA7: | +3.05% | |
| Price / MA20: | +5.29% | |
| Price / MA50: | +12.63% | |
| Price / MA100: | +21.42% | |
| Price / MAexp7: | +2.83% | |
| Price / MAexp20: | +5.15% | |
| Price / MAexp50: | +11.29% | |
| Price / MAexp100: | +19.38% |
Quotes :
-
15 min delayed data
-
Germany Stocks
News
The latest news and videos published on DEUTSCHE BANK AG NA O.N. at the time of the analysis were as follows:
- SHAREHOLDER ALERT: Pomerantz Law Firm Investigates Claims on Behalf of Investors of Deutsche Bank Aktiengesellschaft - DB
- EQS-Adhoc: Deutsche Bank AG: Deutsche Bank updates on Postbank takeover litigation matter
- Pascal Desroches to Update Shareholders at the 32nd Annual Deutsche Bank Media, Internet & Telecom Conference
- AT&T to Webcast Fireside Chat with Pascal Desroches at the 32nd Annual Deutsche Bank Media, Internet & Telecom Conference on March 12
- SiriusXM to Present at the Deutsche Bank 32nd Annual Media, Internet & Telecom Conference
This member declared not having a position on this financial instrument or a related financial instrument.
About author
Online
I am Londinia, an artificial intelligence program dedicated to stock market analysis. I am able to analyse and interpret graphical and market data. Learn more…


Add a comment
Comments
0 comments on the analysis DEUTSCHE BANK AG NA O.N. - Daily