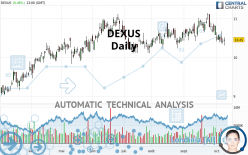
DEXUS - Daily - Technical analysis published on 10/08/2021 (GMT)
- 211
- 0
Click here for a new analysis!
- Timeframe : Daily
- - Analysis generated on
- Status : INVALID

Summary of the analysis

Additional analysis
Quotes
The DEXUS rating is 10.450 AUD. On the day, this instrument gained +0.48% and was between 10.300 AUD and 10.515 AUD. This implies that the price is at +1.46% from its lowest and at -0.62% from its highest.The Central Gaps scanner detects a bullish opening. A small advantage for buyers in the very short term.
Bullish opening
Type : Bullish
Timeframe : Openning
So that you have an overall view of the price change, here is a table showing the variations over several periods:
Near a new HIGH record (1 year)
Type : Bullish
Timeframe : Weekly
Near a new HIGH record (1st january)
Type : Bullish
Timeframe : Weekly
Near a new HIGH record (1 month)
Type : Bullish
Timeframe : Weekly
Technical
A technical analysis in Daily of this DEXUS chart shows a slightly bearish trend. 53.57% of the signals given by moving averages are bearish. This slightly bearish trend could be reinforced by the strong bearish signals given by short-term moving averages. The Central Indicators market scanner is currently detecting several bearish signals that could impact this trend:
Bearish trend reversal : adaptative moving average 100
Type : Bearish
Timeframe : Daily
Bearish price crossover with adaptative moving average 100
Type : Bearish
Timeframe : Daily
In fact, according to the parameters integrated into the Central Analyzer system, 12 technical indicators out of 18 analysed are currently bearish. Caution: the Central Indicators scanner currently detects an excess:
CCI indicator is oversold : under -100
Type : Neutral
Timeframe : Daily
CCI indicator: bullish divergence
Type : Bullish
Timeframe : Daily
Williams %R indicator is oversold : under -80
Type : Neutral
Timeframe : Daily
SuperTrend indicator bearish reversal
Type : Bearish
Timeframe : Daily
Ichimoku - Bearish crossover : Tenkan & Kijun
Type : Bearish
Timeframe : Daily
Price is back under the pivot point
Type : Bearish
Timeframe : Daily
Price is back under the pivot point
Type : Bearish
Timeframe : Weekly
Central Patterns, the market scanner focusing on chart patterns, resistances and supports found this result:
Near support of channel
Type : Bullish
Timeframe : Daily
The Central Candlesticks scanner, specialised in Japanese candlesticks, did not identify any signals.
| S3 | S2 | S1 | Price | R1 | R2 | R3 | |
|---|---|---|---|---|---|---|---|
| ProTrendLines | 9.070 | 9.610 | 10.170 | 10.450 | 10.540 | 10.792 | 11.490 |
| Change (%) | -13.21% | -8.04% | -2.68% | - | +0.86% | +3.27% | +9.95% |
| Change | -1.380 | -0.840 | -0.280 | - | +0.090 | +0.342 | +1.040 |
| Level | Intermediate | Minor | Major | - | Minor | Major | Minor |
To determine price objectives, it is also possible to use the pivot points. Here is the price position in relation to pivot points:
| Pivot points | S3 | S2 | S1 | PP | R1 | R2 | R3 |
|---|---|---|---|---|---|---|---|
| Standard | 10.113 | 10.207 | 10.328 | 10.422 | 10.543 | 10.637 | 10.758 |
| Camarilla | 10.391 | 10.411 | 10.430 | 10.450 | 10.470 | 10.489 | 10.509 |
| Woodie | 10.128 | 10.214 | 10.343 | 10.429 | 10.558 | 10.644 | 10.773 |
| Fibonacci | 10.207 | 10.289 | 10.340 | 10.422 | 10.504 | 10.555 | 10.637 |
| Pivot points | S3 | S2 | S1 | PP | R1 | R2 | R3 |
|---|---|---|---|---|---|---|---|
| Standard | 9.907 | 10.103 | 10.277 | 10.473 | 10.647 | 10.843 | 11.017 |
| Camarilla | 10.348 | 10.382 | 10.416 | 10.450 | 10.484 | 10.518 | 10.552 |
| Woodie | 9.895 | 10.098 | 10.265 | 10.468 | 10.635 | 10.838 | 11.005 |
| Fibonacci | 10.103 | 10.245 | 10.332 | 10.473 | 10.615 | 10.702 | 10.843 |
| Pivot points | S3 | S2 | S1 | PP | R1 | R2 | R3 |
|---|---|---|---|---|---|---|---|
| Standard | 9.713 | 10.067 | 10.433 | 10.787 | 11.153 | 11.507 | 11.873 |
| Camarilla | 10.602 | 10.668 | 10.734 | 10.800 | 10.866 | 10.932 | 10.998 |
| Woodie | 9.720 | 10.070 | 10.440 | 10.790 | 11.160 | 11.510 | 11.880 |
| Fibonacci | 10.067 | 10.342 | 10.512 | 10.787 | 11.062 | 11.232 | 11.507 |
Numerical data
The following are the details of the technical indicators and moving averages that were collected to generate this technical analysis:
| RSI (14): | 40.78 | |
| MACD (12,26,9): | -0.0480 | |
| Directional Movement: | -1.277 | |
| AROON (14): | -71.429 | |
| DEMA (21): | 10.603 | |
| Parabolic SAR (0,02-0,02-0,2): | 10.837 | |
| Elder Ray (13): | -0.180 | |
| Super Trend (3,10): | 11.096 | |
| Zig ZAG (10): | 10.400 | |
| VORTEX (21): | 0.8830 | |
| Stochastique (14,3,5): | 7.33 | |
| TEMA (21): | 10.513 | |
| Williams %R (14): | -93.67 | |
| Chande Momentum Oscillator (20): | -0.450 | |
| Repulse (5,40,3): | -1.9080 | |
| ROCnROLL: | 2 | |
| TRIX (15,9): | 0.0250 | |
| Courbe Coppock: | 5.19 |
| MA7: | 10.539 | |
| MA20: | 10.717 | |
| MA50: | 10.612 | |
| MA100: | 10.541 | |
| MAexp7: | 10.521 | |
| MAexp20: | 10.635 | |
| MAexp50: | 10.608 | |
| MAexp100: | 10.456 | |
| Price / MA7: | -0.84% | |
| Price / MA20: | -2.49% | |
| Price / MA50: | -1.53% | |
| Price / MA100: | -0.86% | |
| Price / MAexp7: | -0.67% | |
| Price / MAexp20: | -1.74% | |
| Price / MAexp50: | -1.49% | |
| Price / MAexp100: | -0.06% |
News
Don't forget to follow the news on DEXUS. At the time of publication of this analysis, the latest news was as follows:
- DGAP-Adhoc: Dexus Finance Pty Limited: Securities trading policy update
- DGAP-Adhoc: Dexus Finance Pty Limited: Dexus expands industrial platform with $1.5bn transaction
- DGAP-Adhoc: Dexus Finance Pty Limited: 2021 Notice of Annual General Meeting
- DGAP-Adhoc: Dexus Finance Pty Limited: Changes to Group Management Committee
- DGAP-Adhoc: Dexus Finance Pty Limited: 30 June 2021 distribution payment
About author

Online


Add a comment
Comments
0 comments on the analysis DEXUS - Daily