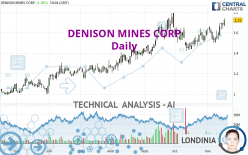
DENISON MINES CORP - Daily - Technical analysis published on 11/16/2023 (GMT)
- 108
- 0
Click here for a new analysis!
- Timeframe : Daily
- - Analysis generated on
- Status : TARGET REACHED

Summary of the analysis

Additional analysis
Quotes
The DENISON MINES CORP rating is 1.72 USD. The price registered an increase of +2.38% on the session and was between 1.65 USD and 1.74 USD. This implies that the price is at +4.24% from its lowest and at -1.15% from its highest.The Central Gaps scanner detects a bearish opening. A small advantage for sellers in the very short term.
Bearish opening
Type : Bearish
Timeframe : Openning
So that you have an overall view of the price change, here is a table showing the variations over several periods:
Near a new HIGH record (1 year)
Type : Bullish
Timeframe : Weekly
Near a new HIGH record (1st january)
Type : Bullish
Timeframe : Weekly
New HIGH record (1 month)
Type : Bullish
Timeframe : Weekly
The Central Volumes scanner notes the presence of abnormal volumes:
Abnormal volumes
Timeframe : 50 days
Technical
Technical analysis of this Daily chart of DENISON MINES CORP indicates that the overall trend is strongly bullish. 92.86% of the signals given by moving averages are bullish. The overall trend is supported by the strong bullish signals from short-term moving averages. The Central Indicators scanner does not detect any result on moving averages that would impact this trend.
Technical indicators are strongly bullish, suggesting that the price increase should continue.
But beware of excesses. The Central Indicators scanner currently detects this:
CCI indicator is overbought : over 100
Type : Neutral
Timeframe : Daily
Williams %R indicator is overbought : over -20
Type : Neutral
Timeframe : Daily
Pivot points : price is over resistance 1
Type : Neutral
Timeframe : Daily
Pivot points : price is over resistance 2
Type : Neutral
Timeframe : Weekly
An analysis of the price chart with the Central Patterns scanner (detector of chart patterns and resistances and supports) shows several results that can have an impact on the price change:
Near horizontal resistance
Type : Bearish
Timeframe : Daily
Resistance of channel is broken
Type : Bullish
Timeframe : Daily
The presence of a bullish Japanese candlestick pattern detected by Central Candlesticks that could cause a very short term rebound was also detected:
Bullish engulfing lines
Type : Bullish
Timeframe : Daily
| S3 | S2 | S1 | Price | R1 | R2 | R3 | |
|---|---|---|---|---|---|---|---|
| ProTrendLines | 1.25 | 1.50 | 1.65 | 1.72 | 1.79 | 2.08 | 4.45 |
| Change (%) | -27.33% | -12.79% | -4.07% | - | +4.07% | +20.93% | +158.72% |
| Change | -0.47 | -0.22 | -0.07 | - | +0.07 | +0.36 | +2.73 |
| Level | Intermediate | Major | Intermediate | - | Intermediate | Intermediate | Major |
Attention could also be paid to pivot points to set price objectives:
| Pivot points | S3 | S2 | S1 | PP | R1 | R2 | R3 |
|---|---|---|---|---|---|---|---|
| Standard | 1.60 | 1.62 | 1.65 | 1.67 | 1.70 | 1.72 | 1.75 |
| Camarilla | 1.67 | 1.67 | 1.68 | 1.68 | 1.69 | 1.69 | 1.69 |
| Woodie | 1.61 | 1.62 | 1.66 | 1.67 | 1.71 | 1.72 | 1.76 |
| Fibonacci | 1.62 | 1.64 | 1.65 | 1.67 | 1.69 | 1.70 | 1.72 |
| Pivot points | S3 | S2 | S1 | PP | R1 | R2 | R3 |
|---|---|---|---|---|---|---|---|
| Standard | 1.40 | 1.45 | 1.52 | 1.57 | 1.64 | 1.69 | 1.76 |
| Camarilla | 1.56 | 1.57 | 1.58 | 1.59 | 1.60 | 1.61 | 1.62 |
| Woodie | 1.41 | 1.46 | 1.53 | 1.58 | 1.65 | 1.70 | 1.77 |
| Fibonacci | 1.45 | 1.50 | 1.52 | 1.57 | 1.62 | 1.64 | 1.69 |
| Pivot points | S3 | S2 | S1 | PP | R1 | R2 | R3 |
|---|---|---|---|---|---|---|---|
| Standard | 1.25 | 1.33 | 1.48 | 1.56 | 1.71 | 1.79 | 1.94 |
| Camarilla | 1.56 | 1.58 | 1.60 | 1.62 | 1.64 | 1.66 | 1.68 |
| Woodie | 1.28 | 1.35 | 1.51 | 1.58 | 1.74 | 1.81 | 1.97 |
| Fibonacci | 1.33 | 1.42 | 1.48 | 1.56 | 1.65 | 1.71 | 1.79 |
Numerical data
The following are the details of the technical indicators and moving averages that were collected to generate this technical analysis:
| RSI (14): | 64.16 | |
| MACD (12,26,9): | 0.0300 | |
| Directional Movement: | 14.55 | |
| AROON (14): | 50.00 | |
| DEMA (21): | 1.64 | |
| Parabolic SAR (0,02-0,02-0,2): | 1.52 | |
| Elder Ray (13): | 0.08 | |
| Super Trend (3,10): | 1.74 | |
| Zig ZAG (10): | 1.72 | |
| VORTEX (21): | 1.1000 | |
| Stochastique (14,3,5): | 90.83 | |
| TEMA (21): | 1.66 | |
| Williams %R (14): | -12.50 | |
| Chande Momentum Oscillator (20): | 0.10 | |
| Repulse (5,40,3): | 7.1500 | |
| ROCnROLL: | 1 | |
| TRIX (15,9): | 0.1600 | |
| Courbe Coppock: | 10.37 |
| MA7: | 1.63 | |
| MA20: | 1.59 | |
| MA50: | 1.58 | |
| MA100: | 1.44 | |
| MAexp7: | 1.65 | |
| MAexp20: | 1.61 | |
| MAexp50: | 1.55 | |
| MAexp100: | 1.46 | |
| Price / MA7: | +5.52% | |
| Price / MA20: | +8.18% | |
| Price / MA50: | +8.86% | |
| Price / MA100: | +19.44% | |
| Price / MAexp7: | +4.24% | |
| Price / MAexp20: | +6.83% | |
| Price / MAexp50: | +10.97% | |
| Price / MAexp100: | +17.81% |
News
The last news published on DENISON MINES CORP at the time of the generation of this analysis was as follows:
- Denison Reports Financial Results from Q3'2023, Including EPS of $0.07 Driven by Significant Gains on Physical Uranium Holdings
- Denison Announces Successful Completion of Inaugural ISR Field Test Program at Tthe Heldeth Túé (THT)
- Denison Announces Successful Completion of Recovered Solution Management Phase of Phoenix ISR Feasibility Field Test
- Denison Completes US$55 Million Offering to Fund Long-Lead Procurement for Phoenix ISR Project
- Denison Announces US$55 Million Bought Deal Offering
About author
Online


Add a comment
Comments
0 comments on the analysis DENISON MINES CORP - Daily