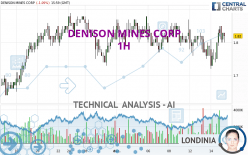
DENISON MINES CORP - 1H - Technical analysis published on 12/15/2023 (GMT)
- 91
- 0
Click here for a new analysis!
- Timeframe : 1H
- - Analysis generated on
- Status : INVALID

Summary of the analysis

Additional analysis
Quotes
DENISON MINES CORP rating 1.83 USD. The price registered a decrease of -0.54% on the session and was between 1.80 USD and 1.85 USD. This implies that the price is at +1.67% from its lowest and at -1.08% from its highest.The Central Gaps scanner detects a bullish opening marking the presence of buyers ahead of sellers at the opening but not sufficiently marked to allow the price to register a quotation gap.
Bullish opening
Type : Bullish
Timeframe : Openning
A study of price movements over other periods shows the following variations:
Near a new HIGH record (1 year)
Type : Bullish
Timeframe : Weekly
Near a new HIGH record (1st january)
Type : Bullish
Timeframe : Weekly
Near a new HIGH record (1 month)
Type : Bullish
Timeframe : Weekly
Technical
Technical analysis of DENISON MINES CORP in 1H shows an overall slightly bullish trend. 50.00% of the signals given by moving averages are bullish. The slightly bullish signals given by short-term moving averages do not show a strengthening of this global trend. The Central Indicators scanner detects bullish signals on moving averages that could impact this trend:
Bullish price crossover with Moving Average 100
Type : Bullish
Timeframe : 1 hour
Bullish price crossover with adaptative moving average 50
Type : Bullish
Timeframe : 1 hour
Bullish price crossover with adaptative moving average 100
Type : Bullish
Timeframe : 1 hour
In fact, 10 technical indicators on 18 studied are currently positioned bullish. Central Indicators, the detector scanner for these technical indicators recently detected a signal:
Price is back under the pivot point
Type : Bearish
Timeframe : Weekly
An analysis of the price chart with the Central Patterns scanner (detector of chart patterns and resistances and supports) shows several results that can have an impact on the price change:
Near horizontal resistance
Type : Bearish
Timeframe : 1 hour
Resistance of channel is broken
Type : Bullish
Timeframe : 1 hour
For a small rebound in the very short term, the Central Candlesticks scanner currently notes the presence of this bullish pattern in Japanese candlesticks:
Bullish harami
Type : Bullish
Timeframe : 1 hour
| S3 | S2 | S1 | Price | R1 | R2 | R3 | |
|---|---|---|---|---|---|---|---|
| ProTrendLines | 1.62 | 1.73 | 1.79 | 1.83 | 1.88 | 2.08 | 4.45 |
| Change (%) | -11.48% | -5.46% | -2.30% | - | +2.73% | +13.44% | +143.17% |
| Change | -0.21 | -0.10 | -0.04 | - | +0.05 | +0.25 | +2.62 |
| Level | Minor | Minor | Major | - | Major | Intermediate | Major |
Pivot points can also be used to set your price objectives. Here is the price situation in relation to pivot points:
| Pivot points | S3 | S2 | S1 | PP | R1 | R2 | R3 |
|---|---|---|---|---|---|---|---|
| Standard | 1.63 | 1.67 | 1.76 | 1.80 | 1.89 | 1.93 | 2.02 |
| Camarilla | 1.80 | 1.82 | 1.83 | 1.84 | 1.85 | 1.86 | 1.88 |
| Woodie | 1.65 | 1.68 | 1.78 | 1.81 | 1.91 | 1.94 | 2.04 |
| Fibonacci | 1.67 | 1.72 | 1.75 | 1.80 | 1.85 | 1.88 | 1.93 |
| Pivot points | S3 | S2 | S1 | PP | R1 | R2 | R3 |
|---|---|---|---|---|---|---|---|
| Standard | 1.68 | 1.72 | 1.79 | 1.83 | 1.90 | 1.94 | 2.01 |
| Camarilla | 1.82 | 1.83 | 1.84 | 1.85 | 1.86 | 1.87 | 1.88 |
| Woodie | 1.69 | 1.73 | 1.80 | 1.84 | 1.91 | 1.95 | 2.02 |
| Fibonacci | 1.72 | 1.77 | 1.79 | 1.83 | 1.88 | 1.90 | 1.94 |
| Pivot points | S3 | S2 | S1 | PP | R1 | R2 | R3 |
|---|---|---|---|---|---|---|---|
| Standard | 1.20 | 1.35 | 1.59 | 1.74 | 1.98 | 2.13 | 2.37 |
| Camarilla | 1.72 | 1.76 | 1.79 | 1.83 | 1.87 | 1.90 | 1.94 |
| Woodie | 1.25 | 1.37 | 1.64 | 1.76 | 2.03 | 2.15 | 2.42 |
| Fibonacci | 1.35 | 1.50 | 1.59 | 1.74 | 1.89 | 1.98 | 2.13 |
Numerical data
The following is the status of technical indicators and moving averages registered at the time this technical analysis was created:
| RSI (14): | 51.94 | |
| MACD (12,26,9): | 0.0000 | |
| Directional Movement: | 2.53 | |
| AROON (14): | 42.85 | |
| DEMA (21): | 1.79 | |
| Parabolic SAR (0,02-0,02-0,2): | 1.74 | |
| Elder Ray (13): | 0.01 | |
| Super Trend (3,10): | 1.86 | |
| Zig ZAG (10): | 1.80 | |
| VORTEX (21): | 1.0400 | |
| Stochastique (14,3,5): | 74.36 | |
| TEMA (21): | 1.80 | |
| Williams %R (14): | -31.85 | |
| Chande Momentum Oscillator (20): | 0.04 | |
| Repulse (5,40,3): | -1.3300 | |
| ROCnROLL: | 1 | |
| TRIX (15,9): | -0.0600 | |
| Courbe Coppock: | 0.22 |
| MA7: | 1.82 | |
| MA20: | 1.82 | |
| MA50: | 1.67 | |
| MA100: | 1.56 | |
| MAexp7: | 1.80 | |
| MAexp20: | 1.80 | |
| MAexp50: | 1.80 | |
| MAexp100: | 1.80 | |
| Price / MA7: | +0.55% | |
| Price / MA20: | +0.55% | |
| Price / MA50: | +9.58% | |
| Price / MA100: | +17.31% | |
| Price / MAexp7: | +1.67% | |
| Price / MAexp20: | +1.67% | |
| Price / MAexp50: | +1.67% | |
| Price / MAexp100: | +1.67% |
News
Don't forget to follow the news on DENISON MINES CORP. At the time of publication of this analysis, the latest news was as follows:
- Denison Reports Financial Results from Q3'2023, Including EPS of $0.07 Driven by Significant Gains on Physical Uranium Holdings
- Denison Announces Successful Completion of Inaugural ISR Field Test Program at Tthe Heldeth Túé (THT)
- Denison Announces Successful Completion of Recovered Solution Management Phase of Phoenix ISR Feasibility Field Test
- Denison Completes US$55 Million Offering to Fund Long-Lead Procurement for Phoenix ISR Project
- Denison Announces US$55 Million Bought Deal Offering
About author
Online


Add a comment
Comments
0 comments on the analysis DENISON MINES CORP - 1H