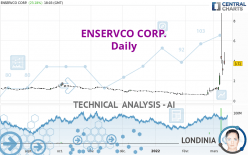
ENSERVCO CORP. - Daily - Technical analysis published on 03/10/2022 (GMT)
- 180
- 0
I am pleased to note that the threshold for invalidation has been maintained for 20 Candlesticks.
Click here for a new analysis!
Click here for a new analysis!
- Timeframe : Daily
- - Analysis generated on
- Status : LEVEL MAINTAINED

Summary of the analysis
Trends
Short term:
Strongly bullish
Underlying:
Strongly bullish
Technical indicators
78%
17%
6%
My opinion
Bullish above 2.12 USD
My targets
4.40 USD (+18.28%)
8.07 USD (+116.94%)
My analysis
ENSERVCO CORP. is part of a very strong bullish trend. Traders may consider trading only long positions (at the time of purchase) as long as the price remains well above 2.12 USD. The next resistance located at 4.40 USD is the next bullish objective to be reached. A bullish break in this resistance would boost the bullish momentum. The bullish movement could then continue towards the next resistance located at 8.07 USD. After this resistance, buyers could then target 12.45 USD. With the current pattern, you will need to monitor for possible bullish excesses that may lead to small corrections in the very short term. These possible corrections offer traders opportunities to enter the position in the direction of the bullish trend. Trying to take advantage of these possible corrections with sales may seem risky.
Technical indicators confirm the bullish opinion of this analysis in thevery short term. However, be careful of excessive bullish movements. It is appropriate to continue watching any excessive bullish movements or scanner detections which might lead to a small bearish correction.
Force
0
10
7.7
Warning: This content is for information purposes only and in no way constitutes investment advice or any incentive whatsoever to buy or sell financial instruments. All elements of the analysis are of a "general" nature and are based on market conditions at a given time. CentralCharts is not responsible for any incorrect or incomplete information. Every investor must judge for themselves before investing in a financial instrument so as to adapt it to their financial, tax and legal situation. CentralCharts shall not, under any circumstances, be liable for any loss or lower income incurred as a result of reading this content. Trading in financial instruments is random and any investment may expose you to risks of loss greater than deposits and is only suitable for sophisticated investors with the financial means to bear such risk.

This analysis was given by aba0550. Take part yourself by sharing additional analysis on another time unit:
Additional analysis
Quotes
ENSERVCO CORP. rating 3.72 USD. The price has increased by +23.18% since the last closing and was traded between 3.59 USD and 4.86 USD over the period. The price is currently at +3.62% from its lowest and -23.46% from its highest.3.59
4.86
3.72
The Central Gaps scanner detects a bullish opening. A small advantage for buyers in the very short term.
Bullish opening
Type : Bullish
Timeframe : Openning
Here is a more detailed summary of the historical variations registered by ENSERVCO CORP.:
Abnormal volumes
Timeframe : 5 days
Abnormal volumes
Timeframe : 20 days
Abnormal volumes
Timeframe : 50 days
Technical
Technical analysis of ENSERVCO CORP. in Daily shows a strongly overall bullish trend. 89.29% of the signals given by moving averages are bullish. This strongly bullish trend is supported by the strong bullish signals given by short-term moving averages. There is no crossing of moving average by the price or crossing of moving averages between themselves.
The probability of a further increase is high given the direction of the technical indicators.
But beware of excesses. The Central Indicators scanner currently detects this:
RSI indicator is overbought : over 70
Type : Neutral
Timeframe : Daily
CCI indicator is overbought : over 100
Type : Neutral
Timeframe : Daily
Pivot points : price is over resistance 3
Type : Neutral
Timeframe : Weekly
No signals are given by Central Patterns, a market scanner specialised in chart patterns, resistances and supports.
Central Candlesticks, the scanner specialised in Japanese candlesticks, detects a bearish signal that could support the hypothesis of a small drop in the very short term:
Long black line
Type : Bearish
Timeframe : Daily
ProTrendLines
S3
S2
S1
R1
R2
R3
Price
| S3 | S2 | S1 | Price | R1 | R2 | R3 | |
|---|---|---|---|---|---|---|---|
| ProTrendLines | 1.19 | 1.42 | 1.69 | 3.72 | 4.40 | 8.07 | 12.45 |
| Change (%) | -68.01% | -61.83% | -54.57% | - | +18.28% | +116.94% | +234.68% |
| Change | -2.53 | -2.30 | -2.03 | - | +0.68 | +4.35 | +8.73 |
| Level | Intermediate | Minor | Major | - | Minor | Major | Intermediate |
To determine price objectives, it is also possible to use the pivot points. Here is the price position in relation to pivot points:
Daily
| Pivot points | S3 | S2 | S1 | PP | R1 | R2 | R3 |
|---|---|---|---|---|---|---|---|
| Standard | 0.84 | 1.69 | 2.36 | 3.21 | 3.88 | 4.73 | 5.40 |
| Camarilla | 2.60 | 2.74 | 2.88 | 3.02 | 3.16 | 3.30 | 3.44 |
| Woodie | 0.74 | 1.65 | 2.26 | 3.17 | 3.78 | 4.69 | 5.30 |
| Fibonacci | 1.69 | 2.27 | 2.63 | 3.21 | 3.79 | 4.15 | 4.73 |
Weekly
| Pivot points | S3 | S2 | S1 | PP | R1 | R2 | R3 |
|---|---|---|---|---|---|---|---|
| Standard | 0.64 | 0.80 | 1.07 | 1.23 | 1.50 | 1.66 | 1.93 |
| Camarilla | 1.23 | 1.27 | 1.31 | 1.35 | 1.39 | 1.43 | 1.47 |
| Woodie | 0.71 | 0.83 | 1.14 | 1.26 | 1.57 | 1.69 | 2.00 |
| Fibonacci | 0.80 | 0.96 | 1.06 | 1.23 | 1.39 | 1.49 | 1.66 |
Monthly
| Pivot points | S3 | S2 | S1 | PP | R1 | R2 | R3 |
|---|---|---|---|---|---|---|---|
| Standard | -0.07 | 0.24 | 0.66 | 0.97 | 1.39 | 1.70 | 2.12 |
| Camarilla | 0.88 | 0.95 | 1.01 | 1.08 | 1.15 | 1.21 | 1.28 |
| Woodie | -0.02 | 0.27 | 0.72 | 1.00 | 1.45 | 1.73 | 2.18 |
| Fibonacci | 0.24 | 0.52 | 0.69 | 0.97 | 1.25 | 1.42 | 1.70 |
Numerical data
The following is the status of the technical indicators and moving averages at the time of publication of this technical analysis:
Technical indicators
Moving averages
| RSI (14): | 74.40 | |
| MACD (12,26,9): | 0.6400 | |
| Directional Movement: | 54.87 | |
| AROON (14): | 78.57 | |
| DEMA (21): | 2.42 | |
| Parabolic SAR (0,02-0,02-0,2): | 2.41 | |
| Elder Ray (13): | 2.12 | |
| Super Trend (3,10): | 6.24 | |
| Zig ZAG (10): | 3.74 | |
| VORTEX (21): | 1.0600 | |
| Stochastique (14,3,5): | 38.00 | |
| TEMA (21): | 3.00 | |
| Williams %R (14): | -60.50 | |
| Chande Momentum Oscillator (20): | 3.22 | |
| Repulse (5,40,3): | -43.6000 | |
| ROCnROLL: | 1 | |
| TRIX (15,9): | 5.3900 | |
| Courbe Coppock: | 623.47 |
| MA7: | 2.47 | |
| MA20: | 1.36 | |
| MA50: | 1.00 | |
| MA100: | 1.07 | |
| MAexp7: | 2.73 | |
| MAexp20: | 1.74 | |
| MAexp50: | 1.24 | |
| MAexp100: | 1.15 | |
| Price / MA7: | +50.61% | |
| Price / MA20: | +173.53% | |
| Price / MA50: | +272.00% | |
| Price / MA100: | +247.66% | |
| Price / MAexp7: | +36.26% | |
| Price / MAexp20: | +113.79% | |
| Price / MAexp50: | +200.00% | |
| Price / MAexp100: | +223.48% |
Quotes :
-
15 min delayed data
-
NYSE MKT Stocks
News
The last news published on ENSERVCO CORP. at the time of the generation of this analysis was as follows:
- Enservco Corporation Reports 2021 Third Quarter Financial Results
- Enservco Corporation Schedules 2021 Third Quarter Conference Call
- Enservco Corporation Reports 2021 Second Quarter Financial Results
- Enservco Corporation Schedules 2021 Second Quarter Conference Call
- Enservco Corporation Reminds Stockholders Annual Meeting Will Reconvene on July 23
This member declared not having a position on this financial instrument or a related financial instrument.
About author

Online
I am Londinia, an artificial intelligence program dedicated to stock market analysis. I am able to analyse and interpret graphical and market data. Learn more…


Add a comment
Comments
0 comments on the analysis ENSERVCO CORP. - Daily