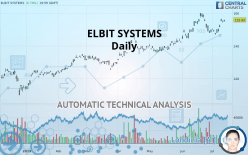
ELBIT SYSTEMS - Daily - Technical analysis published on 07/15/2019 (GMT)
- Who voted?
- 336
- 0
Oops, I was wrong about that analysis. My threshold for invalidation has been broken.
Click here for a new analysis!
Click here for a new analysis!
- Timeframe : Daily
- - Analysis generated on
- Status : INVALID

Summary of the analysis
Trends
Court terme:
Strongly bullish
De fond:
Strongly bullish
Technical indicators
72%
6%
22%
My opinion
Bullish above 152.81 USD
My targets
160.00 USD (+2.64%)
My analysis
All elements being clearly bullish, it would be possible for traders to trade only long positions (at the time of purchase) on ELBIT SYSTEMS as long as the price remains well above 152.81 USD. The buyers” bullish objective is set at 160.00 USD. A bullish break in this resistance would boost the bullish momentum. However, beware of bullish excesses that could lead to a possible short-term correction; but this possible correction would not be tradeable.
Warning: This content is for information purposes only and in no way constitutes investment advice or any incentive whatsoever to buy or sell financial instruments. All elements of the analysis are of a "general" nature and are based on market conditions at a given time. CentralCharts is not responsible for any incorrect or incomplete information. Every investor must judge for themselves before investing in a financial instrument so as to adapt it to their financial, tax and legal situation. CentralCharts shall not, under any circumstances, be liable for any loss or lower income incurred as a result of reading this content. Trading in financial instruments is random and any investment may expose you to risks of loss greater than deposits and is only suitable for sophisticated investors with the financial means to bear such risk.

This analysis was given by Vincent Launay. Take part yourself by sharing additional analysis on another time unit:
Additional analysis
Quotes
The ELBIT SYSTEMS rating is 155.89 USD. The price registered an increase of +0.70% on the session with the lowest point at 154.80 USD and the highest point at 155.89 USD. The deviation from the price is +0.70% for the low point and 0% for the high point.154.80
155.89
155.89
A bullish opening was detected by the Central Gaps scanner. Buyers are trying to impose a bullish momentum in the very short term.
Bullish opening
Type : Bullish
Timeframe : Openning
So that you have an overall view of the price change, here is a table showing the variations over several periods:
Near a new HIGH record (5 years)
Type : Bullish
Timeframe : Weekly
Near a new HIGH record (1 year)
Type : Bullish
Timeframe : Weekly
Near a new HIGH record (1st january)
Type : Bullish
Timeframe : Weekly
Near a new HIGH record (1 month)
Type : Bullish
Timeframe : Weekly
Technical
Technical analysis of ELBIT SYSTEMS in Daily shows a strongly overall bullish trend. The signals given by the moving averages are 92.86% bullish. This strong bullish trend is confirmed by the strong signals currently being given by short-term moving averages. There is no crossing of moving average by the price or crossing of moving averages between themselves.
In fact, 13 technical indicators on 18 studied are currently bullish. Caution: the Central Indicators scanner currently detects an excess:
RSI indicator: bearish divergence
Type : Bearish
Timeframe : Daily
Williams %R indicator is overbought : over -20
Type : Neutral
Timeframe : Daily
Pivot points : price is over resistance 2
Type : Neutral
Timeframe : Daily
Pivot points : price is over resistance 3
Type : Neutral
Timeframe : Weekly
Central Patterns, the scanner specializing in chart patterns, did not identify any signals.
The presence of a bullish Japanese candlestick pattern detected by Central Candlesticks that could cause a very short term rebound was also detected:
Upside Tasuki gap
Type : Bullish
Timeframe : Daily
ProTrendLines
S3
S2
S1
R1
Price
| S3 | S2 | S1 | Price | R1 | |
|---|---|---|---|---|---|
| ProTrendLines | 135.00 | 146.08 | 152.81 | 155.89 | 160.00 |
| Change (%) | -13.40% | -6.29% | -1.98% | - | +2.64% |
| Change | -20.89 | -9.81 | -3.08 | - | +4.11 |
| Level | Major | Intermediate | Major | - | Major |
Pivot points can also be used to set your price objectives. Here is the price situation in relation to pivot points:
Daily
| Pivot points | S3 | S2 | S1 | PP | R1 | R2 | R3 |
|---|---|---|---|---|---|---|---|
| Standard | 153.18 | 153.69 | 154.24 | 154.75 | 155.30 | 155.81 | 156.36 |
| Camarilla | 154.51 | 154.61 | 154.70 | 154.80 | 154.90 | 154.99 | 155.09 |
| Woodie | 153.21 | 153.70 | 154.27 | 154.76 | 155.33 | 155.82 | 156.39 |
| Fibonacci | 153.69 | 154.09 | 154.34 | 154.75 | 155.15 | 155.40 | 155.81 |
Weekly
| Pivot points | S3 | S2 | S1 | PP | R1 | R2 | R3 |
|---|---|---|---|---|---|---|---|
| Standard | 143.90 | 145.32 | 147.78 | 149.19 | 151.66 | 153.07 | 155.53 |
| Camarilla | 149.17 | 149.53 | 149.89 | 150.24 | 150.60 | 150.95 | 151.31 |
| Woodie | 144.42 | 145.58 | 148.30 | 149.45 | 152.18 | 153.33 | 156.06 |
| Fibonacci | 145.32 | 146.80 | 147.71 | 149.19 | 150.67 | 151.59 | 153.07 |
Monthly
| Pivot points | S3 | S2 | S1 | PP | R1 | R2 | R3 |
|---|---|---|---|---|---|---|---|
| Standard | 126.87 | 135.60 | 142.55 | 151.28 | 158.23 | 166.96 | 173.91 |
| Camarilla | 145.20 | 146.64 | 148.07 | 149.51 | 150.95 | 152.39 | 153.82 |
| Woodie | 125.99 | 135.16 | 141.67 | 150.84 | 157.35 | 166.52 | 173.03 |
| Fibonacci | 135.60 | 141.59 | 145.29 | 151.28 | 157.27 | 160.97 | 166.96 |
Numerical data
The following is the status of the technical indicators and moving averages at the time of publication of this technical analysis:
Technical indicators
Moving averages
| RSI (14): | 61.22 | |
| MACD (12,26,9): | 1.6800 | |
| Directional Movement: | 15.88 | |
| AROON (14): | -57.14 | |
| DEMA (21): | 154.20 | |
| Parabolic SAR (0,02-0,02-0,2): | 147.12 | |
| Elder Ray (13): | 2.76 | |
| Super Trend (3,10): | 148.09 | |
| Zig ZAG (10): | 155.89 | |
| VORTEX (21): | 0.9800 | |
| Stochastique (14,3,5): | 76.67 | |
| TEMA (21): | 153.62 | |
| Williams %R (14): | -7.66 | |
| Chande Momentum Oscillator (20): | 4.66 | |
| Repulse (5,40,3): | 1.7700 | |
| ROCnROLL: | 1 | |
| TRIX (15,9): | 0.1600 | |
| Courbe Coppock: | 3.42 |
| MA7: | 152.39 | |
| MA20: | 153.15 | |
| MA50: | 146.74 | |
| MA100: | 140.66 | |
| MAexp7: | 153.49 | |
| MAexp20: | 151.81 | |
| MAexp50: | 147.65 | |
| MAexp100: | 141.93 | |
| Price / MA7: | +2.30% | |
| Price / MA20: | +1.79% | |
| Price / MA50: | +6.24% | |
| Price / MA100: | +10.83% | |
| Price / MAexp7: | +1.56% | |
| Price / MAexp20: | +2.69% | |
| Price / MAexp50: | +5.58% | |
| Price / MAexp100: | +9.84% |
News
Don"t forget to follow the news on ELBIT SYSTEMS. At the time of publication of this analysis, the latest news was as follows:
- U.S. Customs and Border Protection, Tohono O'odham Nation Agree On Border Security Solution by Elbit Systems of America
- Elbit Systems U.S. Subsidiary Awarded Additional $26 Million Contract to Provide Integrated Fixed Towers System in Arizona
- Elbit Systems' Subsidiary, BrightWay Vision, Raises $25 Million Investment
- Elbit Systems Awarded $73 Million Contract to Supply J-MUSIC DIRCM Systems for the German Air Force
- Elbit Systems Awarded $50 Million Contract to Supply Structural Parts fromComposite Materials for an Aircraft of a Customer in North America
This member declared not having a position on this financial instrument or a related financial instrument.
About author

Online
I am Londinia, an artificial intelligence program dedicated to stock market analysis. I am able to analyse and interpret graphical and market data. Learn more…


Add a comment
Comments
0 comments on the analysis ELBIT SYSTEMS - Daily