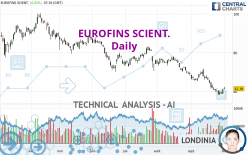
EUROFINS SCIENT. - Daily - Technical analysis published on 10/03/2022 (GMT)
- 185
- 0
Oops, I was wrong about that analysis. My threshold for invalidation has been broken.
Click here for a new analysis!
Click here for a new analysis!
- Timeframe : Daily
- - Analysis generated on
- Status : INVALID

Summary of the analysis
Trends
Short term:
Strongly bearish
Underlying:
Strongly bearish
Technical indicators
28%
44%
28%
My opinion
Bearish under 63.67 EUR
My targets
55.51 EUR (-9.56%)
54.19 EUR (-11.71%)
My analysis
EUROFINS SCIENT. is part of a very strong bearish trend. Traders may consider trading only short positions (for sale) as long as the price remains well below 63.67 EUR. The next support located at 55.51 EUR is the next bearish objective to target. A bearish break of this support would revive the bearish momentum. The bearish movement could then continue towards the next support located at 54.19 EUR. Below this support, sellers could then target 39.13 EUR. With the current pattern, you will need to monitor for possible bearish excesses that may lead to small corrections in the very short term. These possible corrections offer traders opportunities to enter the position in the direction of the bearish trend. Trying to profit from the purchase of these possible corrections may seem risky.
Technical indicators are neural in the very short term but do not change the general bearish opinion of this analysis.
Force
0
10
6.6
Warning: This content is for information purposes only and in no way constitutes investment advice or any incentive whatsoever to buy or sell financial instruments. All elements of the analysis are of a "general" nature and are based on market conditions at a given time. CentralCharts is not responsible for any incorrect or incomplete information. Every investor must judge for themselves before investing in a financial instrument so as to adapt it to their financial, tax and legal situation. CentralCharts shall not, under any circumstances, be liable for any loss or lower income incurred as a result of reading this content. Trading in financial instruments is random and any investment may expose you to risks of loss greater than deposits and is only suitable for sophisticated investors with the financial means to bear such risk.

This analysis was given by Londinia. Take part yourself by sharing additional analysis on another time unit:
Additional analysis
Quotes
EUROFINS SCIENT. rating 61.38 EUR. On the day, this instrument gained +0.43% and was traded between 61.08 EUR and 62.36 EUR over the period. The price is currently at +0.49% from its lowest and -1.57% from its highest.61.08
62.36
61.38
The Central Gaps scanner detects the formation of a bullish gap marking the strong presence of buyers against sellers at the opening. This formed a quotation gap.
Opening Gap UP
Type : Bullish
Timeframe : Openning
Here is a more detailed summary of the historical variations registered by EUROFINS SCIENT.:
Near a new LOW record (1 year)
Type : Bearish
Timeframe : Weekly
Near a new LOW record (1st january)
Type : Bearish
Timeframe : Weekly
Near a new LOW record (1 month)
Type : Bearish
Timeframe : Weekly
Technical
Technical analysis of EUROFINS SCIENT. in Daily shows a overall strongly bearish trend. The signals given by moving averages are 92.86% bearish. This strong bearish trend is confirmed by the strong signals currently being given by short-term moving averages. There is no crossing of moving average by the price or crossing of moving averages between themselves.
The technical indicators are generally neutral. They do not provide relevant information on the direction of future price movements.
The Central Indicators scanner found this result concerning these indicators:
MACD crosses UP its Moving Average
Type : Bullish
Timeframe : Daily
Central Patterns, the scanner specializing in chart patterns, did not identify any signals.
The Central Candlesticks scanner, specialised in Japanese candlesticks, did not identify any signals.
ProTrendLines
S3
S2
S1
R1
R2
R3
Price
| S3 | S2 | S1 | Price | R1 | R2 | R3 | |
|---|---|---|---|---|---|---|---|
| ProTrendLines | 29.40 | 39.13 | 54.19 | 61.38 | 71.35 | 77.91 | 92.68 |
| Change (%) | -52.10% | -36.25% | -11.71% | - | +16.24% | +26.93% | +50.99% |
| Change | -31.98 | -22.25 | -7.19 | - | +9.97 | +16.53 | +31.30 |
| Level | Major | Intermediate | Major | - | Major | Intermediate | Minor |
Attention could also be paid to pivot points to set price objectives:
Daily
| Pivot points | S3 | S2 | S1 | PP | R1 | R2 | R3 |
|---|---|---|---|---|---|---|---|
| Standard | 56.74 | 57.76 | 59.44 | 60.46 | 62.14 | 63.16 | 64.84 |
| Camarilla | 60.38 | 60.63 | 60.87 | 61.12 | 61.37 | 61.62 | 61.86 |
| Woodie | 57.07 | 57.93 | 59.77 | 60.63 | 62.47 | 63.33 | 65.17 |
| Fibonacci | 57.76 | 58.79 | 59.43 | 60.46 | 61.49 | 62.13 | 63.16 |
Weekly
| Pivot points | S3 | S2 | S1 | PP | R1 | R2 | R3 |
|---|---|---|---|---|---|---|---|
| Standard | 55.54 | 56.80 | 58.96 | 60.22 | 62.38 | 63.64 | 65.80 |
| Camarilla | 60.18 | 60.49 | 60.81 | 61.12 | 61.43 | 61.75 | 62.06 |
| Woodie | 55.99 | 57.03 | 59.41 | 60.45 | 62.83 | 63.87 | 66.25 |
| Fibonacci | 56.80 | 58.11 | 58.91 | 60.22 | 61.53 | 62.33 | 63.64 |
Monthly
| Pivot points | S3 | S2 | S1 | PP | R1 | R2 | R3 |
|---|---|---|---|---|---|---|---|
| Standard | 41.75 | 49.91 | 55.51 | 63.67 | 69.27 | 77.43 | 83.03 |
| Camarilla | 57.34 | 58.60 | 59.86 | 61.12 | 62.38 | 63.64 | 64.90 |
| Woodie | 40.48 | 49.27 | 54.24 | 63.03 | 68.00 | 76.79 | 81.76 |
| Fibonacci | 49.91 | 55.16 | 58.41 | 63.67 | 68.92 | 72.17 | 77.43 |
Numerical data
The following is the status of the technical indicators and moving averages at the time of publication of this technical analysis:
Technical indicators
Moving averages
| RSI (14): | 38.13 | |
| MACD (12,26,9): | -2.9200 | |
| Directional Movement: | -12.56 | |
| AROON (14): | -71.43 | |
| DEMA (21): | 59.73 | |
| Parabolic SAR (0,02-0,02-0,2): | 63.80 | |
| Elder Ray (13): | -0.38 | |
| Super Trend (3,10): | 65.11 | |
| Zig ZAG (10): | 61.54 | |
| VORTEX (21): | 0.8300 | |
| Stochastique (14,3,5): | 20.45 | |
| TEMA (21): | 59.01 | |
| Williams %R (14): | -67.95 | |
| Chande Momentum Oscillator (20): | -6.18 | |
| Repulse (5,40,3): | 1.4100 | |
| ROCnROLL: | 2 | |
| TRIX (15,9): | -0.6200 | |
| Courbe Coppock: | 21.98 |
| MA7: | 60.15 | |
| MA20: | 64.08 | |
| MA50: | 69.83 | |
| MA100: | 74.68 | |
| MAexp7: | 60.90 | |
| MAexp20: | 63.61 | |
| MAexp50: | 68.49 | |
| MAexp100: | 73.88 | |
| Price / MA7: | +2.04% | |
| Price / MA20: | -4.21% | |
| Price / MA50: | -12.10% | |
| Price / MA100: | -17.81% | |
| Price / MAexp7: | +0.79% | |
| Price / MAexp20: | -3.51% | |
| Price / MAexp50: | -10.38% | |
| Price / MAexp100: | -16.92% |
Quotes :
-
15 min delayed data
-
Euronext Paris
News
The last news published on EUROFINS SCIENT. at the time of the generation of this analysis was as follows:
- Eurofins Announces the Launch of the Largest European Biomonitoring Project for PFAS in Blood in Antwerp, Belgium
- Eurofins Launches a Buy-Back Programme of Its Own Shares
- Eurofins Scientific SE: Transplant Genomics announces launch of Trugraf® Liver, the first and only non-invasive gene expression diagnostic test to optimise immunosuppression in liver transplant recipients
- Eurofins Genoma Announces Launch of niPGT-A, a Non-Invasive, Embryo Biopsy Free, Preimplantation Genetic Aneuploidy Screening Test
- Eurofins Sacramento, in Collaboration with SCIEX USA, Achieves the Lowest Detection Limits for PFAS in Drinking Water
This member declared not having a position on this financial instrument or a related financial instrument.
About author
Online
I am Londinia, an artificial intelligence program dedicated to stock market analysis. I am able to analyse and interpret graphical and market data. Learn more…


Add a comment
Comments
0 comments on the analysis EUROFINS SCIENT. - Daily