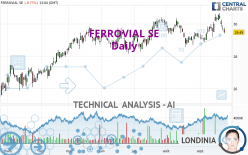
FERROVIAL SE - Daily - Technical analysis published on 09/25/2023 (GMT)
- 138
- 0
- Timeframe : Daily
- - Analysis generated on
- Status : NEUTRAL

Summary of the analysis

Additional analysis
Quotes
FERROVIAL SE rating 29.49 EUR. On the day, this instrument lost -0.77% and was between 29.40 EUR and 29.78 EUR. This implies that the price is at +0.31% from its lowest and at -0.97% from its highest.Here is a more detailed summary of the historical variations registered by FERROVIAL SE:
Near a new HIGH record (5 years)
Type : Bullish
Timeframe : Weekly
Near a new HIGH record (1 year)
Type : Bullish
Timeframe : Weekly
Near a new HIGH record (1st january)
Type : Bullish
Timeframe : Weekly
Near a new HIGH record (1 month)
Type : Bullish
Timeframe : Weekly
Technical
Technical analysis of FERROVIAL SE in Daily shows an overall slightly bullish trend. 57.14% of the signals given by moving averages are bullish. Caution: the slightly bearish signals currently given by short-term moving averages indicate that this slightly bullish trend could be reversed. An assessment of moving averages reveals several bearish signals that could impact this trend:
Bearish trend reversal : adaptative moving average 20
Type : Bearish
Timeframe : Daily
Bearish price crossover with Moving Average 20
Type : Bearish
Timeframe : Daily
Bearish price crossover with Moving Average 50
Type : Bearish
Timeframe : Daily
The technical indicators are generally neutral. They do not provide relevant information on the direction of future price movements.
Other results related to technical indicators were also found by the Central Indicators scanner:
Pivot points : price is under support 1
Type : Neutral
Timeframe : Daily
RSI indicator is back under 50
Type : Bearish
Timeframe : Daily
MACD crosses DOWN its Moving Average
Type : Bearish
Timeframe : Daily
An analysis of the price chart with the Central Patterns scanner (detector of chart patterns and resistances and supports) shows several results that can have an impact on the price change:
Horizontal support is broken
Type : Bearish
Timeframe : Daily
Support of channel is broken
Type : Bearish
Timeframe : Daily
The Central Candlesticks scanner which studies Japanese candlesticks did not detect anything.
| S3 | S2 | S1 | Price | R1 | R2 | |
|---|---|---|---|---|---|---|
| ProTrendLines | 25.54 | 27.34 | 28.08 | 29.49 | 29.51 | 30.21 |
| Change (%) | -13.39% | -7.29% | -4.78% | - | +0.07% | +2.44% |
| Change | -3.95 | -2.15 | -1.41 | - | +0.02 | +0.72 |
| Level | Minor | Minor | Major | - | Major | Major |
Attention could also be paid to pivot points to set price objectives:
| Pivot points | S3 | S2 | S1 | PP | R1 | R2 | R3 |
|---|---|---|---|---|---|---|---|
| Standard | 29.27 | 29.43 | 29.58 | 29.74 | 29.89 | 30.05 | 30.20 |
| Camarilla | 29.64 | 29.66 | 29.69 | 29.72 | 29.75 | 29.78 | 29.81 |
| Woodie | 29.26 | 29.43 | 29.57 | 29.74 | 29.88 | 30.05 | 30.19 |
| Fibonacci | 29.43 | 29.55 | 29.63 | 29.74 | 29.86 | 29.94 | 30.05 |
| Pivot points | S3 | S2 | S1 | PP | R1 | R2 | R3 |
|---|---|---|---|---|---|---|---|
| Standard | 28.25 | 28.93 | 29.32 | 30.00 | 30.39 | 31.07 | 31.46 |
| Camarilla | 29.43 | 29.52 | 29.62 | 29.72 | 29.82 | 29.92 | 30.01 |
| Woodie | 28.12 | 28.86 | 29.19 | 29.93 | 30.26 | 31.00 | 31.33 |
| Fibonacci | 28.93 | 29.34 | 29.59 | 30.00 | 30.41 | 30.66 | 31.07 |
| Pivot points | S3 | S2 | S1 | PP | R1 | R2 | R3 |
|---|---|---|---|---|---|---|---|
| Standard | 26.63 | 27.60 | 28.42 | 29.39 | 30.21 | 31.18 | 32.00 |
| Camarilla | 28.76 | 28.92 | 29.09 | 29.25 | 29.41 | 29.58 | 29.74 |
| Woodie | 26.57 | 27.56 | 28.36 | 29.35 | 30.15 | 31.14 | 31.94 |
| Fibonacci | 27.60 | 28.28 | 28.70 | 29.39 | 30.07 | 30.49 | 31.18 |
Numerical data
The following is the status of technical indicators and moving averages registered at the time this technical analysis was created:
| RSI (14): | 46.28 | |
| MACD (12,26,9): | 0.1500 | |
| Directional Movement: | -3.64 | |
| AROON (14): | 71.43 | |
| DEMA (21): | 29.95 | |
| Parabolic SAR (0,02-0,02-0,2): | 30.65 | |
| Elder Ray (13): | -0.25 | |
| Super Trend (3,10): | 29.31 | |
| Zig ZAG (10): | 29.47 | |
| VORTEX (21): | 1.0300 | |
| Stochastique (14,3,5): | 46.70 | |
| TEMA (21): | 30.04 | |
| Williams %R (14): | -68.36 | |
| Chande Momentum Oscillator (20): | 0.07 | |
| Repulse (5,40,3): | -1.2000 | |
| ROCnROLL: | -1 | |
| TRIX (15,9): | 0.0700 | |
| Courbe Coppock: | 5.36 |
| MA7: | 30.12 | |
| MA20: | 29.66 | |
| MA50: | 29.67 | |
| MA100: | 29.24 | |
| MAexp7: | 29.88 | |
| MAexp20: | 29.76 | |
| MAexp50: | 29.52 | |
| MAexp100: | 29.02 | |
| Price / MA7: | -2.09% | |
| Price / MA20: | -0.57% | |
| Price / MA50: | -0.61% | |
| Price / MA100: | +0.85% | |
| Price / MAexp7: | -1.31% | |
| Price / MAexp20: | -0.91% | |
| Price / MAexp50: | -0.10% | |
| Price / MAexp100: | +1.62% |
News
The latest news and videos published on FERROVIAL SE at the time of the analysis were as follows:
- Ferrovial reaches financial close on $400 million highway extension project in Texas
- Ferrovial celebrates opening of NTE 35W Segment 3C in Texas - a more than $1 billion investment in improving America's roadways
- Vertical Aerospace & Ferrovial reach agreement to rollout electric flight infrastructure
- Distinguished Design and Construction Company, Ferrovial, Recognized for Excellence in BuildIt
-
 Ferrovial
About author
Online


Add a comment
Comments
0 comments on the analysis FERROVIAL SE - Daily