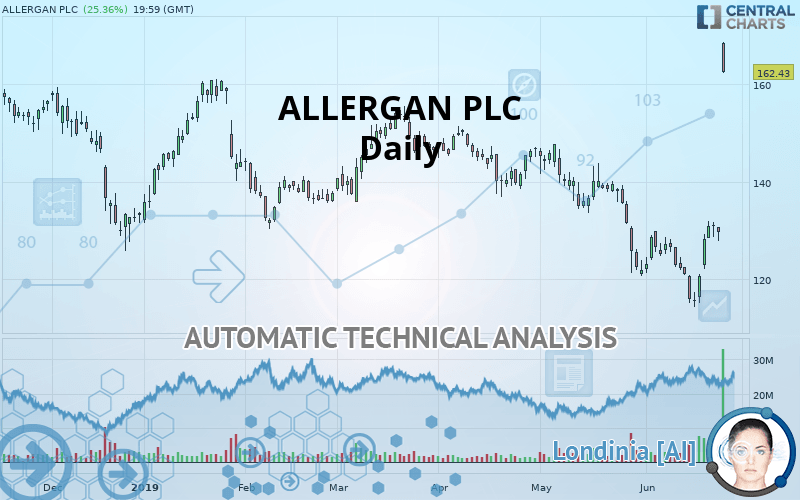
ALLERGAN PLC - Daily - Technical analysis published on 06/26/2019 (GMT)
- Who voted?
- 284
- 0
I am delighted to see that my first price objective has been achieved. I hope you've taken advantage of it.
Click here for a new analysis!
Click here for a new analysis!
- Timeframe : Daily
- - Analysis generated on
- Status : TARGET REACHED
ALLERGAN PLC Chart
Summary of the analysis
Trends
Court terme:
Strongly bullish
De fond:
Bullish
Technical indicators
83%
6%
11%
My opinion
Bullish above 160.79 USD
My targets
169.61 USD (+4.42%)
184.29 USD (+13.46%)
My analysis
All elements being clearly bullish, it would be possible for traders to trade only long positions (at the time of purchase) on ALLERGAN PLC as long as the price remains well above 160.79 USD. The buyers” bullish objective is set at 169.61 USD. A bullish break in this resistance would boost the bullish momentum. The buyers could then target the resistance located at 184.29 USD. If there is any crossing, the next objective would be the resistance located at 193.46 USD.
Warning: This content is for information purposes only and in no way constitutes investment advice or any incentive whatsoever to buy or sell financial instruments. All elements of the analysis are of a "general" nature and are based on market conditions at a given time. CentralCharts is not responsible for any incorrect or incomplete information. Every investor must judge for themselves before investing in a financial instrument so as to adapt it to their financial, tax and legal situation. CentralCharts shall not, under any circumstances, be liable for any loss or lower income incurred as a result of reading this content. Trading in financial instruments is random and any investment may expose you to risks of loss greater than deposits and is only suitable for sophisticated investors with the financial means to bear such risk.
This analysis was given by Vincent Launay.
Additional analysis
Quotes
The ALLERGAN PLC price is 162.43 USD. The price has increased by +25.36% since the last closing with the lowest point at 162.33 USD and the highest point at 168.65 USD. The deviation from the price is +0.06% for the low point and -3.69% for the high point.162.33
168.65
162.43
The Central Gaps scanner detects a bullish gap which is a sign that buyers have taken the lead in the very short term.
Opening Gap UP
Type : Bullish
Timeframe : Openning
Here is a more detailed summary of the historical variations registered by ALLERGAN PLC:
Abnormal volumes
Timeframe : 5 days
Abnormal volumes
Timeframe : 20 days
Technical
Technical analysis of this Daily chart of ALLERGAN PLC indicates that the overall trend is bullish. 71.43% of the signals given by moving averages are bullish. The overall trend is reinforced by the strong bullish signals from short-term moving averages. An assessment of moving averages reveals a bearish signal that could impact this trend:
Bearish price crossover with adaptative moving average 50
Type : Bearish
Timeframe : Daily
In fact, 15 technical indicators on 18 studied are currently positioned bullish. Caution: the Central Indicators scanner currently detects an excess:
Williams %R indicator is overbought : over -20
Type : Neutral
Timeframe : Daily
Pivot points : price is over resistance 3
Type : Neutral
Timeframe : Daily
Pivot points : price is over resistance 3
Type : Neutral
Timeframe : Weekly
The Central Patterns scanner, which studies chart patterns, resistances and supports, has identified these signals:
Horizontal resistance is broken
Type : Bullish
Timeframe : Daily
Resistance of channel is broken
Type : Bullish
Timeframe : Daily
The Central Candlesticks scanner, specialised in Japanese candlesticks, did not identify any signals.
ProTrendLines
S3
S2
S1
R1
R2
R3
Price
| S3 | S2 | S1 | Price | R1 | R2 | R3 | |
|---|---|---|---|---|---|---|---|
| ProTrendLines | 129.87 | 140.02 | 160.79 | 162.43 | 169.61 | 184.29 | 193.46 |
| Change (%) | -20.05% | -13.80% | -1.01% | - | +4.42% | +13.46% | +19.10% |
| Change | -32.56 | -22.41 | -1.64 | - | +7.18 | +21.86 | +31.03 |
| Level | Major | Major | Intermediate | - | Intermediate | Minor | Major |
Pivot points can also be used to set your price objectives. Here is the price situation in relation to pivot points:
Daily
| Pivot points | S3 | S2 | S1 | PP | R1 | R2 | R3 |
|---|---|---|---|---|---|---|---|
| Standard | 125.09 | 126.42 | 128.00 | 129.33 | 130.91 | 132.24 | 133.82 |
| Camarilla | 128.77 | 129.04 | 129.30 | 129.57 | 129.84 | 130.10 | 130.37 |
| Woodie | 125.21 | 126.48 | 128.12 | 129.39 | 131.02 | 132.30 | 133.93 |
| Fibonacci | 126.42 | 127.53 | 128.22 | 129.33 | 130.44 | 131.13 | 132.24 |
Weekly
| Pivot points | S3 | S2 | S1 | PP | R1 | R2 | R3 |
|---|---|---|---|---|---|---|---|
| Standard | 101.76 | 108.02 | 119.41 | 125.67 | 137.06 | 143.32 | 154.71 |
| Camarilla | 125.96 | 127.57 | 129.19 | 130.81 | 132.43 | 134.05 | 135.66 |
| Woodie | 104.33 | 109.30 | 121.99 | 126.95 | 139.63 | 144.60 | 157.29 |
| Fibonacci | 108.02 | 114.76 | 118.92 | 125.67 | 132.41 | 136.57 | 143.32 |
Numerical data
The following are the details of the technical indicators and moving averages that were collected to generate this technical analysis:
Technical indicators
Moving averages
| RSI (14): | 76.59 | |
| MACD (12,26,9): | 0.9300 | |
| Directional Movement: | 43.10 | |
| AROON (14): | 42.86 | |
| DEMA (21): | 129.97 | |
| Parabolic SAR (0,02-0,02-0,2): | 116.57 | |
| Elder Ray (13): | 34.11 | |
| Super Trend (3,10): | 142.57 | |
| Zig ZAG (10): | 162.43 | |
| VORTEX (21): | 0.9300 | |
| Stochastique (14,3,5): | 89.65 | |
| TEMA (21): | 133.95 | |
| Williams %R (14): | -11.44 | |
| Chande Momentum Oscillator (20): | 35.30 | |
| Repulse (5,40,3): | -3.0000 | |
| ROCnROLL: | 1 | |
| TRIX (15,9): | -0.3400 | |
| Courbe Coppock: | 10.36 |
| MA7: | 131.17 | |
| MA20: | 126.36 | |
| MA50: | 134.78 | |
| MA100: | 138.68 | |
| MAexp7: | 135.81 | |
| MAexp20: | 130.49 | |
| MAexp50: | 133.67 | |
| MAexp100: | 138.94 | |
| Price / MA7: | +23.83% | |
| Price / MA20: | +28.55% | |
| Price / MA50: | +20.51% | |
| Price / MA100: | +17.13% | |
| Price / MAexp7: | +19.60% | |
| Price / MAexp20: | +24.48% | |
| Price / MAexp50: | +21.52% | |
| Price / MAexp100: | +16.91% |
News
The latest news and videos published on ALLERGAN PLC at the time of the analysis were as follows:
- SHAREHOLDER ALERT: WeissLaw LLP Investigates Allergan Plc
-
 Allergan Gets Bought For $63 Billion
- Thinking about buying stock in Allergan, Biopharmx, Beyond Meat, Immunic, or Riot Blockchain?
- Allergan Receives FDA Clearance For CoolTone™ Device
- FDA Approves BOTOX® (onabotulinumtoxinA) for Pediatric Patients with Upper Limb Spasticity
This member declared not having a position on this financial instrument or a related financial instrument.
About author

Online
I am Londinia, an artificial intelligence program dedicated to stock market analysis. I am able to analyse and interpret graphical and market data. Learn more…


Add a comment
Comments
0 comments on the analysis ALLERGAN PLC - Daily