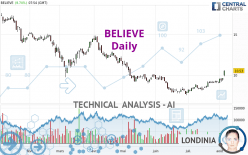
BELIEVE - Daily - Technical analysis published on 08/04/2022 (GMT)
- 199
- 0
Click here for a new analysis!
- Timeframe : Daily
- - Analysis generated on
- Status : INVALID

Summary of the analysis

Additional analysis
Quotes
The BELIEVE rating is 10.530 EUR. The price has increased by +9.75% since the last closing with the lowest point at 9.830 EUR and the highest point at 10.570 EUR. The deviation from the price is +7.12% for the low point and -0.38% for the high point.The Central Gaps scanner detects a bullish gap which is a sign that buyers have taken the lead in the very short term.
Opening Gap UP
Type : Bullish
Timeframe : Openning
Here is a more detailed summary of the historical variations registered by BELIEVE:
New HIGH record (1 month)
Type : Bullish
Timeframe : Weekly
Technical
A technical analysis in Daily of this BELIEVE chart shows a bullish trend. 64.29% of the signals given by moving averages are bullish. The overall trend is reinforced by the strong bullish signals from short-term moving averages. An assessment of moving averages reveals a bullish signal that could impact this trend:
Bullish price crossover with Moving Average 100
Type : Bullish
Timeframe : Daily
In fact, 17 technical indicators on 18 studied are currently bullish. Caution: the Central Indicators scanner currently detects an excess:
RSI indicator is overbought : over 70
Type : Neutral
Timeframe : Daily
CCI indicator is overbought : over 100
Type : Neutral
Timeframe : Daily
Williams %R indicator is overbought : over -20
Type : Neutral
Timeframe : Daily
Pivot points : price is over resistance 3
Type : Neutral
Timeframe : Daily
Pivot points : price is over resistance 3
Type : Neutral
Timeframe : Weekly
Ichimoku : price is over the cloud
Type : Bullish
Timeframe : Daily
Central Patterns, the market scanner focusing on chart patterns, resistances and supports found these results:
Near horizontal resistance
Type : Bearish
Timeframe : Daily
Resistance of channel is broken
Type : Bullish
Timeframe : Daily
The presence of a bullish Japanese candlestick pattern detected by Central Candlesticks that could cause a very short term rebound was also detected:
Upside gap
Type : Bullish
Timeframe : Daily
| S2 | S1 | Price | R1 | R2 | R3 | |
|---|---|---|---|---|---|---|
| ProTrendLines | 7.680 | 9.116 | 10.530 | 10.568 | 14.641 | 17.370 |
| Change (%) | -27.07% | -13.43% | - | +0.36% | +39.04% | +64.96% |
| Change | -2.850 | -1.414 | - | +0.038 | +4.111 | +6.840 |
| Level | Minor | Major | - | Minor | Intermediate | Minor |
Pivot points can also be used to set your price objectives. Here is the price situation in relation to pivot points:
| Pivot points | S3 | S2 | S1 | PP | R1 | R2 | R3 |
|---|---|---|---|---|---|---|---|
| Standard | 9.033 | 9.152 | 9.373 | 9.492 | 9.713 | 9.832 | 10.053 |
| Camarilla | 9.502 | 9.533 | 9.564 | 9.595 | 9.626 | 9.657 | 9.689 |
| Woodie | 9.085 | 9.178 | 9.425 | 9.518 | 9.765 | 9.858 | 10.105 |
| Fibonacci | 9.152 | 9.282 | 9.362 | 9.492 | 9.622 | 9.702 | 9.832 |
| Pivot points | S3 | S2 | S1 | PP | R1 | R2 | R3 |
|---|---|---|---|---|---|---|---|
| Standard | 8.613 | 8.797 | 8.908 | 9.092 | 9.203 | 9.387 | 9.498 |
| Camarilla | 8.939 | 8.966 | 8.993 | 9.020 | 9.047 | 9.074 | 9.101 |
| Woodie | 8.578 | 8.779 | 8.873 | 9.074 | 9.168 | 9.369 | 9.463 |
| Fibonacci | 8.797 | 8.909 | 8.979 | 9.092 | 9.204 | 9.274 | 9.387 |
| Pivot points | S3 | S2 | S1 | PP | R1 | R2 | R3 |
|---|---|---|---|---|---|---|---|
| Standard | 6.647 | 7.223 | 8.122 | 8.698 | 9.597 | 10.173 | 11.072 |
| Camarilla | 8.614 | 8.750 | 8.885 | 9.020 | 9.155 | 9.290 | 9.426 |
| Woodie | 6.808 | 7.304 | 8.283 | 8.779 | 9.758 | 10.254 | 11.233 |
| Fibonacci | 7.223 | 7.787 | 8.135 | 8.698 | 9.262 | 9.610 | 10.173 |
Numerical data
The following is the status of technical indicators and moving averages registered at the time this technical analysis was created:
| RSI (14): | 71.91 | |
| MACD (12,26,9): | 0.3100 | |
| Directional Movement: | 31.077 | |
| AROON (14): | 100.000 | |
| DEMA (21): | 9.422 | |
| Parabolic SAR (0,02-0,02-0,2): | 9.120 | |
| Elder Ray (13): | 0.863 | |
| Super Trend (3,10): | 9.003 | |
| Zig ZAG (10): | 10.440 | |
| VORTEX (21): | 1.1520 | |
| Stochastique (14,3,5): | 93.84 | |
| TEMA (21): | 9.841 | |
| Williams %R (14): | -1.91 | |
| Chande Momentum Oscillator (20): | 1.845 | |
| Repulse (5,40,3): | 9.8770 | |
| ROCnROLL: | 1 | |
| TRIX (15,9): | 0.2940 | |
| Courbe Coppock: | 25.56 |
| MA7: | 9.469 | |
| MA20: | 8.947 | |
| MA50: | 8.755 | |
| MA100: | 10.259 | |
| MAexp7: | 9.581 | |
| MAexp20: | 9.099 | |
| MAexp50: | 9.173 | |
| MAexp100: | 10.247 | |
| Price / MA7: | +11.20% | |
| Price / MA20: | +17.69% | |
| Price / MA50: | +20.27% | |
| Price / MA100: | +2.64% | |
| Price / MAexp7: | +9.91% | |
| Price / MAexp20: | +15.73% | |
| Price / MAexp50: | +14.79% | |
| Price / MAexp100: | +2.76% |
News
The latest news and videos published on BELIEVE at the time of the analysis were as follows:
- JULY HARVARD-CAPS HARRIS POLL: BIDEN APPROVAL REMAINS AT HISTORIC LOWS AS VOTERS OVERWHELMINGLY BELIEVE WE ARE IN OR HEADED FOR A RECESSION
-
 Jesse Watters: You are not going to believe who is the new judge in Paul Pelosi's DUI case
- Information mensuelle relative au nombre total de droits de vote et d’actions composant le capital social / Monthly information relating to the total number of voting rights and shares making up the share capital
-
Benson: I don’t believe Biden will be the nominee of the Democratic Party
- American Migraine Foundation Survey Shows Nearly All People with Migraine and Healthcare Professionals Believe Migraine and Mental Health Significantly Impact Each Other
About author
Online


Add a comment
Comments
0 comments on the analysis BELIEVE - Daily