ILLUMINA INC. - Daily - Technical analysis published on 09/11/2019 (GMT)
- 292
- 0
Click here for a new analysis!
- Timeframe : Daily
- - Analysis generated on
- Status : INVALID

Summary of the analysis

Additional analysis
Quotes
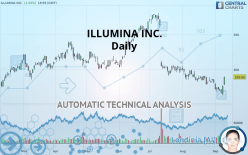
The ILLUMINA INC. rating is 289.66 USD. The price registered an increase of +4.93% on the session with the lowest point at 277.83 USD and the highest point at 289.87 USD. The deviation from the price is +4.26% for the low point and -0.07% for the high point.A bullish gap was detected at the opening by the Central Gaps scanner. There are a lot of buyers and they have the upper hand in the very short term.
Opening Gap UP
Type : Bullish
Timeframe : Openning
A study of price movements over other periods shows the following variations:
Near a new HIGH record (1 month)
Type : Bullish
Timeframe : Weekly
Technical
A technical analysis in Daily of this ILLUMINA INC. chart shows a bearish trend. 75% of the signals given by moving averages are bearish. Caution: the neutral signals currently given by short-term moving averages show us that the global trend is losing momentum. The Central Indicators market scanner currently does not detect any result that concerns moving averages.
The probability of a further increase is slight given the direction of the technical indicators.
But beware of excesses. The Central Indicators scanner currently detects this:
CCI indicator is oversold : under -100
Type : Neutral
Timeframe : Daily
CCI indicator: bullish divergence
Type : Bullish
Timeframe : Daily
Williams %R indicator is overbought : over -20
Type : Neutral
Timeframe : Daily
Pivot points : price is over resistance 2
Type : Neutral
Timeframe : Daily
Pivot points : price is over resistance 2
Type : Neutral
Timeframe : Weekly
MACD crosses UP its Moving Average
Type : Bullish
Timeframe : Daily
Price is back under the pivot point
Type : Bearish
Timeframe : Weekly
The Central Patterns scanner, which studies chart patterns, resistances and supports, has identified this signal:
Near horizontal resistance
Type : Bearish
Timeframe : Daily
For a small rebound in the very short term, the Central Candlesticks scanner currently notes the presence of this bullish pattern in Japanese candlesticks:
Bullish engulfing lines
Type : Bullish
Timeframe : Daily
| S3 | S2 | S1 | Price | R1 | R2 | R3 | |
|---|---|---|---|---|---|---|---|
| ProTrendLines | 209.54 | 240.02 | 272.28 | 289.66 | 300.59 | 321.18 | 367.06 |
| Change (%) | -27.66% | -17.14% | -6.00% | - | +3.77% | +10.88% | +26.72% |
| Change | -80.12 | -49.64 | -17.38 | - | +10.93 | +31.52 | +77.40 |
| Level | Minor | Major | Major | - | Major | Intermediate | Major |
Attention could also be paid to pivot points to set price objectives:
| Pivot points | S3 | S2 | S1 | PP | R1 | R2 | R3 |
|---|---|---|---|---|---|---|---|
| Standard | 252.91 | 258.11 | 267.07 | 272.27 | 281.23 | 286.43 | 295.39 |
| Camarilla | 272.15 | 273.44 | 274.74 | 276.04 | 277.34 | 278.64 | 279.93 |
| Woodie | 254.80 | 259.05 | 268.96 | 273.21 | 283.12 | 287.37 | 297.28 |
| Fibonacci | 258.11 | 263.52 | 266.86 | 272.27 | 277.68 | 281.02 | 286.43 |
| Pivot points | S3 | S2 | S1 | PP | R1 | R2 | R3 |
|---|---|---|---|---|---|---|---|
| Standard | 252.85 | 260.43 | 265.21 | 272.79 | 277.57 | 285.15 | 289.93 |
| Camarilla | 266.60 | 267.73 | 268.87 | 270.00 | 271.13 | 272.27 | 273.40 |
| Woodie | 251.46 | 259.73 | 263.82 | 272.09 | 276.18 | 284.45 | 288.54 |
| Fibonacci | 260.43 | 265.15 | 268.07 | 272.79 | 277.51 | 280.43 | 285.15 |
| Pivot points | S3 | S2 | S1 | PP | R1 | R2 | R3 |
|---|---|---|---|---|---|---|---|
| Standard | 243.00 | 260.56 | 270.95 | 288.51 | 298.90 | 316.46 | 326.85 |
| Camarilla | 273.65 | 276.22 | 278.78 | 281.34 | 283.90 | 286.46 | 289.03 |
| Woodie | 239.42 | 258.77 | 267.37 | 286.72 | 295.32 | 314.67 | 323.27 |
| Fibonacci | 260.56 | 271.24 | 277.83 | 288.51 | 299.19 | 305.78 | 316.46 |
Numerical data
The following is the status of the technical indicators and moving averages at the time of publication of this technical analysis:
| RSI (14): | 53.18 | |
| MACD (12,26,9): | -6.5600 | |
| Directional Movement: | -1.21 | |
| AROON (14): | -85.72 | |
| DEMA (21): | 272.39 | |
| Parabolic SAR (0,02-0,02-0,2): | 263.30 | |
| Elder Ray (13): | 4.87 | |
| Super Trend (3,10): | 260.45 | |
| Zig ZAG (10): | 289.66 | |
| VORTEX (21): | 0.8500 | |
| Stochastique (14,3,5): | 48.29 | |
| TEMA (21): | 274.08 | |
| Williams %R (14): | -6.04 | |
| Chande Momentum Oscillator (20): | 10.22 | |
| Repulse (5,40,3): | 6.9400 | |
| ROCnROLL: | -1 | |
| TRIX (15,9): | -0.3900 | |
| Courbe Coppock: | 7.45 |
| MA7: | 274.03 | |
| MA20: | 281.07 | |
| MA50: | 302.03 | |
| MA100: | 313.97 | |
| MAexp7: | 277.77 | |
| MAexp20: | 282.08 | |
| MAexp50: | 295.99 | |
| MAexp100: | 305.94 | |
| Price / MA7: | +5.70% | |
| Price / MA20: | +3.06% | |
| Price / MA50: | -4.10% | |
| Price / MA100: | -7.74% | |
| Price / MAexp7: | +4.28% | |
| Price / MAexp20: | +2.69% | |
| Price / MAexp50: | -2.14% | |
| Price / MAexp100: | -5.32% |
News
The last news published on ILLUMINA INC. at the time of the generation of this analysis was as follows:
- Illumina Reports Financial Results for First Quarter of Fiscal Year 2019
- Investor Network: Illumina, Inc. to Host Earnings Call
- Philips and Illumina team up with Navican, an Intermountain Healthcare Company, to Accelerate the Delivery of Precision Medicine to Health Systems Worldwide
- OPKO Health’s GeneDx Announces Participation in Illumina’s iHope Program on International Rare Disease Day
-
 Illumina
About author

Online


Add a comment
Comments
0 comments on the analysis ILLUMINA INC. - Daily