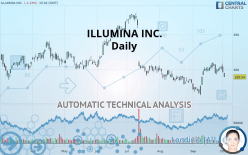
ILLUMINA INC. - Daily - Technical analysis published on 10/02/2019 (GMT)
- Who voted?
- 331
- 0
Click here for a new analysis!
- Timeframe : Daily
- - Analysis generated on
- Status : INVALID

Summary of the analysis

Additional analysis
Quotes
The ILLUMINA INC. rating is 289.54 USD. On the day, this instrument lost -2.19% and was between 288.81 USD and 295.32 USD. This implies that the price is at +0.25% from its lowest and at -1.96% from its highest.The Central Gaps scanner detects a bearish gap which is a sign that the sellers have taken the lead in the very short term.
Opening Gap DOWN
Type : Bearish
Timeframe : Openning
Here is a more detailed summary of the historical variations registered by ILLUMINA INC.:
Technical
A technical analysis in Daily of this ILLUMINA INC. chart shows a sharp bearish trend. 85.71% of the signals given by moving averages are bearish. The slightly bearish signals from short-term moving averages show that the overall trend is slowing down. The Central Indicators scanner detects bullish and bearish signals on moving averages that could impact this trend:
Bearish trend reversal : Moving Average 50
Type : Bearish
Timeframe : Daily
Bearish trend reversal : adaptative moving average 20
Type : Bearish
Timeframe : Daily
Bearish trend reversal : adaptative moving average 50
Type : Bearish
Timeframe : Daily
Moving Average bullish crossovers : MA20 & MA50
Type : Bullish
Timeframe : Daily
Bearish price crossover with adaptative moving average 50
Type : Bearish
Timeframe : Daily
An assessment of technical indicators shows a slightly bearish signal.
Other results related to technical indicators were also found by the Central Indicators scanner:
Pivot points : price is under support 1
Type : Neutral
Timeframe : Daily
Pivot points : price is under support 1
Type : Neutral
Timeframe : Weekly
Parabolic SAR indicator bearish reversal
Type : Bearish
Timeframe : Daily
Momentum indicator is back under 0
Type : Bearish
Timeframe : Daily
Williams %R indicator is back under -50
Type : Bearish
Timeframe : Daily
The Central Patterns scanner, which studies chart patterns, resistances and supports, has identified this signal:
Near horizontal resistance
Type : Bearish
Timeframe : Daily
No result was found by the Central Candlesticks scanner on Japanese candlesticks.
| S3 | S2 | S1 | Price | R1 | R2 | R3 | |
|---|---|---|---|---|---|---|---|
| ProTrendLines | 186.17 | 240.02 | 272.28 | 289.54 | 300.59 | 321.18 | 338.37 |
| Change (%) | -35.70% | -17.10% | -5.96% | - | +3.82% | +10.93% | +16.86% |
| Change | -103.37 | -49.52 | -17.26 | - | +11.05 | +31.64 | +48.83 |
| Level | Intermediate | Major | Major | - | Major | Intermediate | Minor |
Attention could also be paid to pivot points to set price objectives:
| Pivot points | S3 | S2 | S1 | PP | R1 | R2 | R3 |
|---|---|---|---|---|---|---|---|
| Standard | 278.71 | 287.09 | 291.56 | 299.94 | 304.41 | 312.79 | 317.26 |
| Camarilla | 292.49 | 293.66 | 294.84 | 296.02 | 297.20 | 298.38 | 299.55 |
| Woodie | 276.75 | 286.11 | 289.60 | 298.96 | 302.45 | 311.81 | 315.30 |
| Fibonacci | 287.09 | 292.00 | 295.04 | 299.94 | 304.85 | 307.89 | 312.79 |
| Pivot points | S3 | S2 | S1 | PP | R1 | R2 | R3 |
|---|---|---|---|---|---|---|---|
| Standard | 275.73 | 284.12 | 292.70 | 301.09 | 309.67 | 318.06 | 326.64 |
| Camarilla | 296.61 | 298.17 | 299.72 | 301.28 | 302.84 | 304.39 | 305.95 |
| Woodie | 275.83 | 284.17 | 292.80 | 301.14 | 309.77 | 318.11 | 326.74 |
| Fibonacci | 284.12 | 290.60 | 294.61 | 301.09 | 307.57 | 311.58 | 318.06 |
| Pivot points | S3 | S2 | S1 | PP | R1 | R2 | R3 |
|---|---|---|---|---|---|---|---|
| Standard | 227.74 | 245.52 | 274.87 | 292.65 | 322.00 | 339.78 | 369.13 |
| Camarilla | 291.26 | 295.58 | 299.90 | 304.22 | 308.54 | 312.86 | 317.18 |
| Woodie | 233.53 | 248.41 | 280.66 | 295.54 | 327.79 | 342.67 | 374.92 |
| Fibonacci | 245.52 | 263.52 | 274.65 | 292.65 | 310.65 | 321.78 | 339.78 |
Numerical data
The following is the status of the technical indicators and moving averages at the time of publication of this technical analysis:
| RSI (14): | 45.43 | |
| MACD (12,26,9): | 2.0400 | |
| Directional Movement: | -6.38 | |
| AROON (14): | -57.14 | |
| DEMA (21): | 298.00 | |
| Parabolic SAR (0,02-0,02-0,2): | 310.13 | |
| Elder Ray (13): | -4.97 | |
| Super Trend (3,10): | 286.15 | |
| Zig ZAG (10): | 289.62 | |
| VORTEX (21): | 1.0900 | |
| Stochastique (14,3,5): | 35.26 | |
| TEMA (21): | 302.24 | |
| Williams %R (14): | -97.09 | |
| Chande Momentum Oscillator (20): | -11.34 | |
| Repulse (5,40,3): | -4.6700 | |
| ROCnROLL: | 2 | |
| TRIX (15,9): | 0.1300 | |
| Courbe Coppock: | 9.84 |
| MA7: | 297.98 | |
| MA20: | 294.08 | |
| MA50: | 291.70 | |
| MA100: | 311.44 | |
| MAexp7: | 297.48 | |
| MAexp20: | 295.70 | |
| MAexp50: | 297.88 | |
| MAexp100: | 304.59 | |
| Price / MA7: | -2.83% | |
| Price / MA20: | -1.54% | |
| Price / MA50: | -0.74% | |
| Price / MA100: | -7.03% | |
| Price / MAexp7: | -2.67% | |
| Price / MAexp20: | -2.08% | |
| Price / MAexp50: | -2.80% | |
| Price / MAexp100: | -4.94% |
News
Don"t forget to follow the news on ILLUMINA INC.. At the time of publication of this analysis, the latest news was as follows:
- Illumina and Broad Institute Announce Agreement to Co-Develop Genomic Secondary Analysis Tools
- Illumina Names Joydeep Goswami Senior Vice President of Corporate Development and Strategic Planning
- Illumina Recommends Stockholders Reject Mini-Tender Offer by TRC Capital Corporation
- Illumina Reports Financial Results for First Quarter of Fiscal Year 2019
- Investor Network: Illumina, Inc. to Host Earnings Call
About author

Online


Add a comment
Comments
0 comments on the analysis ILLUMINA INC. - Daily