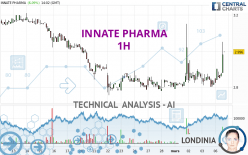
INNATE PHARMA - 1H - Technical analysis published on 03/06/2023 (GMT)
- 170
- 0
Click here for a new analysis!
- Timeframe : 1H
- - Analysis generated on
- Status : TARGET REACHED
Summary of the analysis

Additional analysis
Quotes
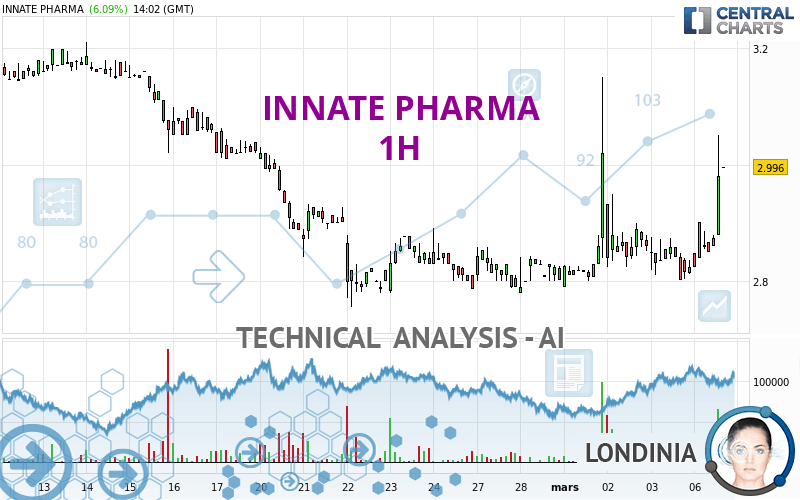
The INNATE PHARMA price is 3.020 EUR. The price has increased by +6.94% since the last closing with the lowest point at 2.824 EUR and the highest point at 3.050 EUR. The deviation from the price is +6.94% for the low point and -0.98% for the high point.The Central Gaps scanner detects a bullish opening. A small advantage for buyers in the very short term.
Bullish opening
Type : Bullish
Timeframe : Openning
A study of price movements over other periods shows the following variations:
Near a new LOW record (1st january)
Type : Bearish
Timeframe : Weekly
Near a new LOW record (1 month)
Type : Bearish
Timeframe : Weekly
Technical
Technical analysis of INNATE PHARMA in 1H shows an overall bullish trend. The signals returned by the moving averages are 67.86% bullish. This bullish trend is reinforced by the strong signals currently being given by short-term moving averages. The Central Indicators scanner does not detect any result on moving averages that would impact this trend.
Technical indicators are strongly bullish, suggesting that the price increase should continue.
Caution: the Central Indicators scanner currently detects an excess:
CCI indicator is overbought : over 100
Type : Neutral
Timeframe : 1 hour
Pivot points : price is over resistance 3
Type : Neutral
Timeframe : 1 hour
Parabolic SAR indicator bullish reversal
Type : Bullish
Timeframe : 1 hour
SuperTrend indicator bullish reversal
Type : Bullish
Timeframe : 1 hour
Price is back over the pivot point
Type : Bullish
Timeframe : Weekly
An analysis of the price chart with the Central Patterns scanner (detector of chart patterns and resistances and supports) shows several results that can have an impact on the price change:
Near horizontal resistance
Type : Bearish
Timeframe : 1 hour
Resistance of channel is broken
Type : Bullish
Timeframe : 1 hour
The presence of these bullish Japanese candlestick patterns detected by Central Candlesticks that could cause a very short term rebound were also noted:
White line without lower shadow
Type : Bullish
Timeframe : 1 hour
Long white line
Type : Bullish
Timeframe : 1 hour
| S3 | S2 | S1 | Price | R1 | R2 | R3 | |
|---|---|---|---|---|---|---|---|
| ProTrendLines | 2.589 | 2.780 | 2.892 | 3.020 | 3.051 | 3.147 | 3.264 |
| Change (%) | -14.27% | -7.95% | -4.24% | - | +1.03% | +4.21% | +8.08% |
| Change | -0.431 | -0.240 | -0.128 | - | +0.031 | +0.127 | +0.244 |
| Level | Major | Intermediate | Minor | - | Major | Major | Intermediate |
Attention could also be paid to pivot points to set price objectives:
| Pivot points | S3 | S2 | S1 | PP | R1 | R2 | R3 |
|---|---|---|---|---|---|---|---|
| Standard | 2.718 | 2.760 | 2.792 | 2.834 | 2.866 | 2.908 | 2.940 |
| Camarilla | 2.804 | 2.810 | 2.817 | 2.824 | 2.831 | 2.838 | 2.844 |
| Woodie | 2.713 | 2.758 | 2.787 | 2.832 | 2.861 | 2.906 | 2.935 |
| Fibonacci | 2.760 | 2.788 | 2.806 | 2.834 | 2.862 | 2.880 | 2.908 |
| Pivot points | S3 | S2 | S1 | PP | R1 | R2 | R3 |
|---|---|---|---|---|---|---|---|
| Standard | 2.316 | 2.548 | 2.686 | 2.918 | 3.056 | 3.288 | 3.426 |
| Camarilla | 2.722 | 2.756 | 2.790 | 2.824 | 2.858 | 2.892 | 2.926 |
| Woodie | 2.269 | 2.525 | 2.639 | 2.895 | 3.009 | 3.265 | 3.379 |
| Fibonacci | 2.548 | 2.689 | 2.777 | 2.918 | 3.059 | 3.147 | 3.288 |
| Pivot points | S3 | S2 | S1 | PP | R1 | R2 | R3 |
|---|---|---|---|---|---|---|---|
| Standard | 1.995 | 2.375 | 2.589 | 2.969 | 3.183 | 3.563 | 3.777 |
| Camarilla | 2.639 | 2.693 | 2.748 | 2.802 | 2.857 | 2.911 | 2.965 |
| Woodie | 1.911 | 2.334 | 2.505 | 2.928 | 3.099 | 3.522 | 3.693 |
| Fibonacci | 2.375 | 2.602 | 2.742 | 2.969 | 3.196 | 3.336 | 3.563 |
Numerical data
The following is the status of the technical indicators and moving averages at the time of publication of this technical analysis:
| RSI (14): | 69.36 | |
| MACD (12,26,9): | 0.0180 | |
| Directional Movement: | 36.529 | |
| AROON (14): | 57.143 | |
| DEMA (21): | 2.878 | |
| Parabolic SAR (0,02-0,02-0,2): | 2.802 | |
| Elder Ray (13): | 0.088 | |
| Super Trend (3,10): | 2.803 | |
| Zig ZAG (10): | 3.000 | |
| VORTEX (21): | 0.9610 | |
| Stochastique (14,3,5): | 66.61 | |
| TEMA (21): | 2.892 | |
| Williams %R (14): | -20.16 | |
| Chande Momentum Oscillator (20): | 0.164 | |
| Repulse (5,40,3): | 4.2820 | |
| ROCnROLL: | 1 | |
| TRIX (15,9): | 0.0180 | |
| Courbe Coppock: | 1.21 |
| MA7: | 2.868 | |
| MA20: | 2.990 | |
| MA50: | 3.168 | |
| MA100: | 2.661 | |
| MAexp7: | 2.887 | |
| MAexp20: | 2.864 | |
| MAexp50: | 2.857 | |
| MAexp100: | 2.894 | |
| Price / MA7: | +5.30% | |
| Price / MA20: | +1.00% | |
| Price / MA50: | -4.67% | |
| Price / MA100: | +13.49% | |
| Price / MAexp7: | +4.61% | |
| Price / MAexp20: | +5.45% | |
| Price / MAexp50: | +5.71% | |
| Price / MAexp100: | +4.35% |
News
The latest news and videos published on INNATE PHARMA at the time of the analysis were as follows:
- Number of Shares and Voting Rights of Innate Pharma as of February 1, 2023
- Number of Shares and Voting Rights of Innate Pharma as of February 1, 2023
- Innate Pharma to Participate in Upcoming Investor Conferences
- Innate Pharma to Participate in Upcoming Investor Conferences
- Innate Pharma Announces HSR Clearance Regarding Expansion of Its Collaboration With Sanofi on NK Cell Engagers
About author

Online


Add a comment
Comments
0 comments on the analysis INNATE PHARMA - 1H