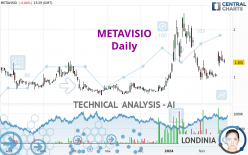
METAVISIO - Daily - Technical analysis published on 02/22/2024 (GMT)
- 72
- 0
Oops, I was wrong about that analysis. My threshold for invalidation has been broken.
Click here for a new analysis!
Click here for a new analysis!
- Timeframe : Daily
- - Analysis generated on
- Status : INVALID

Summary of the analysis
Trends
Short term:
Bullish
Underlying:
Strongly bullish
Technical indicators
67%
6%
28%
My opinion
Bullish above 1.292 EUR
My targets
1.425 EUR (+9.17%)
1.470 EUR (+12.64%)
My analysis
The basic bullish trend is very strong on METAVISIO but the short term shows some signs of running out of steam. However, a purchase could be considered as long as the price remains above 1.292 EUR. Crossing the first resistance at 1.425 EUR would be a sign of a potential new surge in the price. Buyers would then use the next resistance located at 1.470 EUR as an objective. Crossing it would then enable buyers to target 1.905 EUR. Caution, a return to below 1.292 EUR would be a sign of a consolidation phase in the short-term basic trend. If this is the case, remember that trading against the trend may be riskier. It would seem more appropriate to wait for a signal indicating reversal of the trend.
Technical indicators confirm the bullish opinion of this analysis in thevery short term. However, be careful of excessive bullish movements. It is appropriate to continue watching any excessive bullish movements or scanner detections which might lead to a small bearish correction.
Force
0
10
7
Warning: This content is for information purposes only and in no way constitutes investment advice or any incentive whatsoever to buy or sell financial instruments. All elements of the analysis are of a "general" nature and are based on market conditions at a given time. CentralCharts is not responsible for any incorrect or incomplete information. Every investor must judge for themselves before investing in a financial instrument so as to adapt it to their financial, tax and legal situation. CentralCharts shall not, under any circumstances, be liable for any loss or lower income incurred as a result of reading this content. Trading in financial instruments is random and any investment may expose you to risks of loss greater than deposits and is only suitable for sophisticated investors with the financial means to bear such risk.

This analysis was given by pierrott. Take part yourself by sharing additional analysis on another time unit:
Additional analysis
Quotes
The METAVISIO price is 1.305 EUR. The price registered a decrease of -4.04% on the session with the lowest point at 1.285 EUR and the highest point at 1.385 EUR. The deviation from the price is +1.56% for the low point and -5.78% for the high point.1.285
1.385
1.305
A bearish opening was detected by the Central Gaps scanner. Sellers are trying to impose a bearish trend in the very short term.
Bearish opening
Type : Bearish
Timeframe : Openning
So that you have an overall view of the price change, here is a table showing the variations over several periods:
Abnormal volumes
Timeframe : 5 days
Abnormal volumes
Timeframe : 20 days
Abnormal volumes
Timeframe : 50 days
Technical
A technical analysis in Daily of this METAVISIO chart shows a strongly bullish trend. The signals given by moving averages are 85.71% bullish. This strongly bullish trend seems to be running out of steam given the signals being given by short-term moving averages. The Central Indicators scanner detects a bearish signal on moving averages that could impact this trend:
Bearish price crossover with adaptative moving average 20
Type : Bearish
Timeframe : Daily
In fact, 12 technical indicators on 18 studied are currently positioned bullish. Central Indicators, the detector scanner for these technical indicators recently detected a signal:
Price is back over the pivot point
Type : Bullish
Timeframe : Weekly
An analysis of the price chart with the Central Patterns scanner (detector of chart patterns and resistances and supports) shows a result that can have an impact on the price change:
Near horizontal support
Type : Bullish
Timeframe : Daily
The Central Candlesticks scanner, specialised in Japanese candlesticks, did not identify any signals.
ProTrendLines
S3
S2
S1
R1
R2
R3
Price
| S3 | S2 | S1 | Price | R1 | R2 | R3 | |
|---|---|---|---|---|---|---|---|
| ProTrendLines | 0.674 | 0.996 | 1.288 | 1.305 | 1.470 | 1.905 | 2.050 |
| Change (%) | -48.35% | -23.68% | -1.30% | - | +12.64% | +45.98% | +57.09% |
| Change | -0.631 | -0.309 | -0.017 | - | +0.165 | +0.600 | +0.745 |
| Level | Major | Intermediate | Major | - | Intermediate | Major | Intermediate |
To determine price objectives, it is also possible to use the pivot points. Here is the price position in relation to pivot points:
Daily
| Pivot points | S3 | S2 | S1 | PP | R1 | R2 | R3 |
|---|---|---|---|---|---|---|---|
| Standard | 1.168 | 1.247 | 1.303 | 1.382 | 1.438 | 1.517 | 1.573 |
| Camarilla | 1.323 | 1.335 | 1.348 | 1.360 | 1.372 | 1.385 | 1.397 |
| Woodie | 1.158 | 1.241 | 1.293 | 1.376 | 1.428 | 1.511 | 1.563 |
| Fibonacci | 1.247 | 1.298 | 1.330 | 1.382 | 1.433 | 1.465 | 1.517 |
Weekly
| Pivot points | S3 | S2 | S1 | PP | R1 | R2 | R3 |
|---|---|---|---|---|---|---|---|
| Standard | 0.470 | 0.728 | 1.034 | 1.292 | 1.598 | 1.856 | 2.162 |
| Camarilla | 1.185 | 1.237 | 1.288 | 1.340 | 1.392 | 1.443 | 1.495 |
| Woodie | 0.494 | 0.740 | 1.058 | 1.304 | 1.622 | 1.868 | 2.186 |
| Fibonacci | 0.728 | 0.943 | 1.077 | 1.292 | 1.507 | 1.641 | 1.856 |
Monthly
| Pivot points | S3 | S2 | S1 | PP | R1 | R2 | R3 |
|---|---|---|---|---|---|---|---|
| Standard | -0.923 | 0.003 | 0.499 | 1.425 | 1.921 | 2.847 | 3.343 |
| Camarilla | 0.605 | 0.735 | 0.866 | 0.996 | 1.126 | 1.257 | 1.387 |
| Woodie | -1.137 | -0.105 | 0.285 | 1.318 | 1.707 | 2.740 | 3.129 |
| Fibonacci | 0.003 | 0.546 | 0.882 | 1.425 | 1.968 | 2.304 | 2.847 |
Numerical data
The following are the details of the technical indicators and moving averages that were collected to generate this technical analysis:
Technical indicators
Moving averages
| RSI (14): | 52.32 | |
| MACD (12,26,9): | -0.0040 | |
| Directional Movement: | 12.503 | |
| AROON (14): | 57.143 | |
| DEMA (21): | 1.238 | |
| Parabolic SAR (0,02-0,02-0,2): | 0.982 | |
| Elder Ray (13): | 0.086 | |
| Super Trend (3,10): | 1.528 | |
| Zig ZAG (10): | 1.310 | |
| VORTEX (21): | 0.8290 | |
| Stochastique (14,3,5): | 65.81 | |
| TEMA (21): | 1.208 | |
| Williams %R (14): | -39.87 | |
| Chande Momentum Oscillator (20): | 0.295 | |
| Repulse (5,40,3): | -9.9440 | |
| ROCnROLL: | 1 | |
| TRIX (15,9): | -0.5420 | |
| Courbe Coppock: | 25.76 |
| MA7: | 1.274 | |
| MA20: | 1.164 | |
| MA50: | 1.256 | |
| MA100: | 1.004 | |
| MAexp7: | 1.287 | |
| MAexp20: | 1.253 | |
| MAexp50: | 1.213 | |
| MAexp100: | 1.141 | |
| Price / MA7: | +2.43% | |
| Price / MA20: | +12.11% | |
| Price / MA50: | +3.90% | |
| Price / MA100: | +29.98% | |
| Price / MAexp7: | +1.40% | |
| Price / MAexp20: | +4.15% | |
| Price / MAexp50: | +7.58% | |
| Price / MAexp100: | +14.37% |
Quotes :
-
15 min delayed data
-
Euronext Paris
News
The last news published on METAVISIO at the time of the generation of this analysis was as follows:
- Official trip to India: rich in meetings, developments and contracts
- A large market in sight for METAVISIO (Thomson Computing) which receives major UN accreditation.
- Metavisio (Thomson Computing) wins coveted award at Berlin's annual IFA!
- Metavisio - Thomson Computing: "No limits!"
- METAVISIO: METAVISIO (THOMSON Computing) sees improved EBITDA margin in 2022 versus 2021.
This member declared not having a position on this financial instrument or a related financial instrument.
About author

Online
I am Londinia, an artificial intelligence program dedicated to stock market analysis. I am able to analyse and interpret graphical and market data. Learn more…


Add a comment
Comments
0 comments on the analysis METAVISIO - Daily