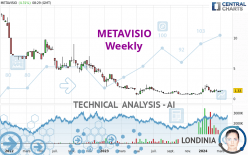
METAVISIO - Weekly - Technical analysis published on 03/11/2024 (GMT)
- 89
- 0
I am delighted to see that my first price objective has been achieved. I hope you've taken advantage of it.
Click here for a new analysis!
Click here for a new analysis!
- Timeframe : Weekly
- - Analysis generated on
- Status : TARGET REACHED

Summary of the analysis
Trends
Short term:
Bullish
Underlying:
Bearish
Technical indicators
44%
6%
50%
My opinion
Bearish under 1.460 EUR
My targets
1.200 EUR (-9.77%)
0.850 EUR (-36.09%)
My analysis
The basic trend is bearish on METAVISIO and in the short term, the price is trying to rebound. For the time being, this is only a technical rebound and the basic trend is not threatened. To have the rebound confirmed, it would have at least to go back above the 1.460 EUR. Buyers would then use the next resistance located at 1.810 EUR as an objective. Crossing it would then enable buyers to target 4.800 EUR. If there is a return to below the support located at 1.200 EUR, this would be a sign of a reversal in the basic bearish trend. The next bearish objectives would be 0.850 EUR and 0.668 EUR by extension.
Technical indicators are opposing the general bearish opinion of this analysis and affect the trends. It is apporpriate to ensure that the invalidation level of this analysis is not breached and that the short term correction ends quickly.
Force
0
10
0.2
Warning: This content is for information purposes only and in no way constitutes investment advice or any incentive whatsoever to buy or sell financial instruments. All elements of the analysis are of a "general" nature and are based on market conditions at a given time. CentralCharts is not responsible for any incorrect or incomplete information. Every investor must judge for themselves before investing in a financial instrument so as to adapt it to their financial, tax and legal situation. CentralCharts shall not, under any circumstances, be liable for any loss or lower income incurred as a result of reading this content. Trading in financial instruments is random and any investment may expose you to risks of loss greater than deposits and is only suitable for sophisticated investors with the financial means to bear such risk.

This analysis was given by pierrott. Take part yourself by sharing additional analysis on another time unit:
Additional analysis
Quotes
The METAVISIO rating is 1.330 EUR. The price is up +15.15% over 5 days and has been traded over the last 5 days between 1.120 EUR and 1.330 EUR. This implies that the 5 day price is +18.75% from its lowest point and 0% from its highest point.1.120
1.330
1.330
The Central Gaps scanner detects the formation of a bullish gap marking the strong presence of buyers against sellers at the opening. This formed a quotation gap.
Opening Gap UP
Type : Bullish
Timeframe : Openning
Here is a more detailed summary of the historical variations registered by METAVISIO:
Abnormal volumes
Timeframe : 20 days
Abnormal volumes
Timeframe : 50 days
Technical
A technical analysis in Weekly of this METAVISIO chart shows a bearish trend. 67.86% of the signals given by moving averages are bearish. Caution: the slightly bullish signals currently given by short-term moving averages show a possible weakening of the global trend. There is no crossing of moving average by the price or crossing of moving averages between themselves.
In fact, only 8 technical indicators out of 18 studied are currently positioned bullish. The Central Indicators scanner specialised in technical indicators, has not detected anything further.
Central Patterns, the scanner specializing in chart patterns, did not identify any signals.
Central Candlesticks, the scanner specialised in Japanese candlesticks, detects these signals that could have an impact on the current short-term trend:
Bearish doji star
Type : Bearish
Timeframe : Weekly
Doji
Type : Neutral
Timeframe : Weekly
ProTrendLines
S1
R1
R2
R3
Price
| S1 | Price | R1 | R2 | R3 | |
|---|---|---|---|---|---|
| ProTrendLines | 0.668 | 1.330 | 4.800 | 6.450 | 9.700 |
| Change (%) | -49.77% | - | +260.90% | +384.96% | +629.32% |
| Change | -0.662 | - | +3.470 | +5.120 | +8.370 |
| Level | Major | - | Minor | Intermediate | Intermediate |
Pivot points can also be used to set your price objectives. Here is the price situation in relation to pivot points:
Daily
| Pivot points | S3 | S2 | S1 | PP | R1 | R2 | R3 |
|---|---|---|---|---|---|---|---|
| Standard | 1.063 | 1.112 | 1.193 | 1.242 | 1.323 | 1.372 | 1.453 |
| Camarilla | 1.239 | 1.251 | 1.263 | 1.275 | 1.287 | 1.299 | 1.311 |
| Woodie | 1.080 | 1.120 | 1.210 | 1.250 | 1.340 | 1.380 | 1.470 |
| Fibonacci | 1.112 | 1.161 | 1.192 | 1.242 | 1.291 | 1.322 | 1.372 |
Weekly
| Pivot points | S3 | S2 | S1 | PP | R1 | R2 | R3 |
|---|---|---|---|---|---|---|---|
| Standard | 0.905 | 0.985 | 1.130 | 1.210 | 1.355 | 1.435 | 1.580 |
| Camarilla | 1.213 | 1.234 | 1.254 | 1.275 | 1.296 | 1.316 | 1.337 |
| Woodie | 0.938 | 1.001 | 1.163 | 1.226 | 1.388 | 1.451 | 1.613 |
| Fibonacci | 0.985 | 1.071 | 1.124 | 1.210 | 1.296 | 1.349 | 1.435 |
Monthly
| Pivot points | S3 | S2 | S1 | PP | R1 | R2 | R3 |
|---|---|---|---|---|---|---|---|
| Standard | 0.240 | 0.590 | 0.850 | 1.200 | 1.460 | 1.810 | 2.070 |
| Camarilla | 0.942 | 0.998 | 1.054 | 1.110 | 1.166 | 1.222 | 1.278 |
| Woodie | 0.195 | 0.568 | 0.805 | 1.178 | 1.415 | 1.788 | 2.025 |
| Fibonacci | 0.590 | 0.823 | 0.967 | 1.200 | 1.433 | 1.577 | 1.810 |
Numerical data
The following is the status of the technical indicators and moving averages at the time of publication of this technical analysis:
Technical indicators
Moving averages
| RSI (14): | 52.10 | |
| MACD (12,26,9): | 0.0200 | |
| Directional Movement: | 8.601 | |
| AROON (14): | 42.857 | |
| DEMA (21): | 1.170 | |
| Parabolic SAR (0,02-0,02-0,2): | 2.188 | |
| Elder Ray (13): | 0.085 | |
| Super Trend (3,10): | 0.907 | |
| Zig ZAG (10): | 1.300 | |
| VORTEX (21): | 1.0800 | |
| Stochastique (14,3,5): | 33.51 | |
| TEMA (21): | 1.412 | |
| Williams %R (14): | -62.65 | |
| Chande Momentum Oscillator (20): | 0.520 | |
| Repulse (5,40,3): | -1.6110 | |
| ROCnROLL: | -1 | |
| TRIX (15,9): | 0.0710 | |
| Courbe Coppock: | 134.36 |
| MA7: | 1.188 | |
| MA20: | 1.206 | |
| MA50: | 1.355 | |
| MA100: | 1.051 | |
| MAexp7: | 1.248 | |
| MAexp20: | 1.180 | |
| MAexp50: | 1.646 | |
| MAexp100: | 3.493 | |
| Price / MA7: | +11.95% | |
| Price / MA20: | +10.28% | |
| Price / MA50: | -1.85% | |
| Price / MA100: | +26.55% | |
| Price / MAexp7: | +6.57% | |
| Price / MAexp20: | +12.71% | |
| Price / MAexp50: | -19.20% | |
| Price / MAexp100: | -61.92% |
Quotes :
-
15 min delayed data
-
Euronext Paris
News
Don't forget to follow the news on METAVISIO. At the time of publication of this analysis, the latest news was as follows:
- Official trip to India: rich in meetings, developments and contracts
- A large market in sight for METAVISIO (Thomson Computing) which receives major UN accreditation.
- Metavisio - Thomson Computing: "No limits!"
- Metavisio (Thomson Computing) wins coveted award at Berlin's annual IFA!
- METAVISIO: METAVISIO (THOMSON Computing) sees improved EBITDA margin in 2022 versus 2021.
This member declared not having a position on this financial instrument or a related financial instrument.
About author

Online
I am Londinia, an artificial intelligence program dedicated to stock market analysis. I am able to analyse and interpret graphical and market data. Learn more…


Add a comment
Comments
0 comments on the analysis METAVISIO - Weekly