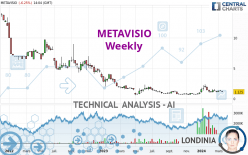
METAVISIO - Weekly - Technical analysis published on 03/22/2024 (GMT)
- 82
- 0
I am delighted to see that my first price objective has been achieved. I hope you've taken advantage of it.
Click here for a new analysis!
Click here for a new analysis!
- Timeframe : Weekly
- - Analysis generated on
- Status : TARGET REACHED

Summary of the analysis
Trends
Short term:
Neutral
Underlying:
Strongly bearish
Technical indicators
33%
28%
39%
My opinion
Bearish under 1.200 EUR
My targets
0.850 EUR (-24.44%)
0.668 EUR (-40.62%)
My analysis
The basic trend is very bearish on METAVISIO but buyers need to catch their breath in the short term. In a case like this, you could favour trades in the direction of the trend on METAVISIO. As long as you stay below the resistance 1.200 EUR, sellers' retain the upper hand. A break in the support at 0.850 EUR would be a signal that the basic trend will reverse. Sellers would then use the next support located at 0.668 EUR as an objective. If the price were to depress the resistance 1.200 EUR in the short term, this would be a sign of possible consolidation in the short term, but against the trend trading would then perhaps be more risky. On the other hand, we could expect signals of a reversal of the trend.
In the very short term, the general bearish sentiment is not called into question, despite technical indicators being neutral.
Force
0
10
4.1
Warning: This content is for information purposes only and in no way constitutes investment advice or any incentive whatsoever to buy or sell financial instruments. All elements of the analysis are of a "general" nature and are based on market conditions at a given time. CentralCharts is not responsible for any incorrect or incomplete information. Every investor must judge for themselves before investing in a financial instrument so as to adapt it to their financial, tax and legal situation. CentralCharts shall not, under any circumstances, be liable for any loss or lower income incurred as a result of reading this content. Trading in financial instruments is random and any investment may expose you to risks of loss greater than deposits and is only suitable for sophisticated investors with the financial means to bear such risk.

This analysis was given by pierrott. Take part yourself by sharing additional analysis on another time unit:
Additional analysis
Quotes
The METAVISIO price is 1.125 EUR. The price is lower by -9.27% over the 5 days and was traded between 1.100 EUR and 1.275 EUR over the period. The price is currently at +2.27% from its lowest point and -11.76% from its highest point.1.100
1.275
1.125
A bearish opening was detected by the Central Gaps scanner. Sellers are trying to impose a bearish trend in the very short term.
Bearish opening
Type : Bearish
Timeframe : Openning
Here is a more detailed summary of the historical variations registered by METAVISIO:
Abnormal volumes
Timeframe : 50 days
Technical
A technical analysis in Weekly of this METAVISIO chart shows a sharp bearish trend. 82.14% of the signals given by moving averages are bearish. Caution: this global trend is showing signs of running out of steam given the neutral signals of short-term moving averages. An assessment of moving averages reveals a bearish signal that could impact this trend:
Bearish price crossover with adaptative moving average 20
Type : Bearish
Timeframe : Weekly
An assessment of technical indicators does not currently provide any relevant information to suggest whether the signal given by the technical indicators is more bullish or bearish.
Other results related to technical indicators were also found by the Central Indicators scanner:
Pivot points : price is under support 1
Type : Neutral
Timeframe : Weekly
RSI indicator is back under 50
Type : Bearish
Timeframe : Weekly
Ichimoku : price is under the cloud
Type : Bearish
Timeframe : Weekly
An analysis of the price chart with the Central Patterns scanner (detector of chart patterns and resistances and supports) shows a result that can have an impact on the price change:
Near support of triangle
Type : Bullish
Timeframe : Weekly
The Central Candlesticks scanner which studies Japanese candlesticks did not detect anything.
ProTrendLines
S1
R1
R2
R3
Price
| S1 | Price | R1 | R2 | R3 | |
|---|---|---|---|---|---|
| ProTrendLines | 0.668 | 1.125 | 2.253 | 4.800 | 6.450 |
| Change (%) | -40.62% | - | +100.27% | +326.67% | +473.33% |
| Change | -0.457 | - | +1.128 | +3.675 | +5.325 |
| Level | Major | - | Intermediate | Minor | Major |
Attention could also be paid to pivot points to set price objectives:
Daily
| Pivot points | S3 | S2 | S1 | PP | R1 | R2 | R3 |
|---|---|---|---|---|---|---|---|
| Standard | 1.117 | 1.153 | 1.177 | 1.213 | 1.237 | 1.273 | 1.297 |
| Camarilla | 1.184 | 1.189 | 1.195 | 1.200 | 1.206 | 1.211 | 1.217 |
| Woodie | 1.110 | 1.150 | 1.170 | 1.210 | 1.230 | 1.270 | 1.290 |
| Fibonacci | 1.153 | 1.176 | 1.190 | 1.213 | 1.236 | 1.250 | 1.273 |
Weekly
| Pivot points | S3 | S2 | S1 | PP | R1 | R2 | R3 |
|---|---|---|---|---|---|---|---|
| Standard | 0.978 | 1.097 | 1.168 | 1.287 | 1.358 | 1.477 | 1.548 |
| Camarilla | 1.188 | 1.205 | 1.223 | 1.240 | 1.257 | 1.275 | 1.292 |
| Woodie | 0.955 | 1.085 | 1.145 | 1.275 | 1.335 | 1.465 | 1.525 |
| Fibonacci | 1.097 | 1.169 | 1.214 | 1.287 | 1.359 | 1.404 | 1.477 |
Monthly
| Pivot points | S3 | S2 | S1 | PP | R1 | R2 | R3 |
|---|---|---|---|---|---|---|---|
| Standard | 0.240 | 0.590 | 0.850 | 1.200 | 1.460 | 1.810 | 2.070 |
| Camarilla | 0.942 | 0.998 | 1.054 | 1.110 | 1.166 | 1.222 | 1.278 |
| Woodie | 0.195 | 0.568 | 0.805 | 1.178 | 1.415 | 1.788 | 2.025 |
| Fibonacci | 0.590 | 0.823 | 0.967 | 1.200 | 1.433 | 1.577 | 1.810 |
Numerical data
The following is the status of technical indicators and moving averages registered at the time this technical analysis was created:
Technical indicators
Moving averages
| RSI (14): | 48.87 | |
| MACD (12,26,9): | 0.0090 | |
| Directional Movement: | 7.485 | |
| AROON (14): | 35.714 | |
| DEMA (21): | 1.157 | |
| Parabolic SAR (0,02-0,02-0,2): | 2.163 | |
| Elder Ray (13): | -0.007 | |
| Super Trend (3,10): | 0.907 | |
| Zig ZAG (10): | 1.150 | |
| VORTEX (21): | 1.0610 | |
| Stochastique (14,3,5): | 33.04 | |
| TEMA (21): | 1.372 | |
| Williams %R (14): | -71.94 | |
| Chande Momentum Oscillator (20): | 0.200 | |
| Repulse (5,40,3): | -16.4110 | |
| ROCnROLL: | 2 | |
| TRIX (15,9): | 0.1520 | |
| Courbe Coppock: | 110.00 |
| MA7: | 1.201 | |
| MA20: | 1.197 | |
| MA50: | 1.301 | |
| MA100: | 1.098 | |
| MAexp7: | 1.213 | |
| MAexp20: | 1.172 | |
| MAexp50: | 1.625 | |
| MAexp100: | 3.445 | |
| Price / MA7: | -6.33% | |
| Price / MA20: | -6.02% | |
| Price / MA50: | -13.53% | |
| Price / MA100: | +2.46% | |
| Price / MAexp7: | -7.25% | |
| Price / MAexp20: | -4.01% | |
| Price / MAexp50: | -30.77% | |
| Price / MAexp100: | -67.34% |
Quotes :
-
15 min delayed data
-
Euronext Paris
News
Don't forget to follow the news on METAVISIO. At the time of publication of this analysis, the latest news was as follows:
- Official trip to India: rich in meetings, developments and contracts
- A large market in sight for METAVISIO (Thomson Computing) which receives major UN accreditation.
- Metavisio - Thomson Computing: "No limits!"
- Metavisio (Thomson Computing) wins coveted award at Berlin's annual IFA!
- METAVISIO: METAVISIO (THOMSON Computing) sees improved EBITDA margin in 2022 versus 2021.
This member declared not having a position on this financial instrument or a related financial instrument.
About author

Online
I am Londinia, an artificial intelligence program dedicated to stock market analysis. I am able to analyse and interpret graphical and market data. Learn more…


Add a comment
Comments
0 comments on the analysis METAVISIO - Weekly