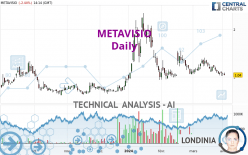
METAVISIO - Daily - Technical analysis published on 04/03/2024 (GMT)
- 74
- 0
I am delighted to see that my first price objective has been achieved. I hope you've taken advantage of it.
Click here for a new analysis!
Click here for a new analysis!
- Timeframe : Daily
- - Analysis generated on
- Status : TARGET REACHED

Summary of the analysis
Trends
Short term:
Strongly bearish
Underlying:
Bearish
Technical indicators
6%
67%
28%
My opinion
Bearish under 1.168 EUR
My targets
0.996 EUR (-4.23%)
0.783 EUR (-24.68%)
My analysis
METAVISIO is part of a very strong bearish trend. Traders may consider trading only short positions (for sale) as long as the price remains well below 1.168 EUR. The next support located at 0.996 EUR is the next bearish objective to target. A bearish break of this support would revive the bearish momentum. The bearish movement could then continue towards the next support located at 0.783 EUR. Below this support, sellers could then target 0.668 EUR.
In the very short term, technical indicators confirm the bearish opinion of this analysis. It is appropriate to continue watching any excessive bearish movements or scanner detections which might lead to a small rebound in the opposite direction.
Force
0
10
5.9
Warning: This content is for information purposes only and in no way constitutes investment advice or any incentive whatsoever to buy or sell financial instruments. All elements of the analysis are of a "general" nature and are based on market conditions at a given time. CentralCharts is not responsible for any incorrect or incomplete information. Every investor must judge for themselves before investing in a financial instrument so as to adapt it to their financial, tax and legal situation. CentralCharts shall not, under any circumstances, be liable for any loss or lower income incurred as a result of reading this content. Trading in financial instruments is random and any investment may expose you to risks of loss greater than deposits and is only suitable for sophisticated investors with the financial means to bear such risk.

This analysis was given by pierrott. Take part yourself by sharing additional analysis on another time unit:
Additional analysis
Quotes
The METAVISIO rating is 1.040 EUR. The price is lower by -2.44% since the last closing with the lowest point at 1.028 EUR and the highest point at 1.090 EUR. The deviation from the price is +1.17% for the low point and -4.59% for the high point.1.028
1.090
1.040
The Central Gaps scanner detects a bearish opening marking the presence of sellers ahead of buyers at the opening but not sufficiently marked to allow the price to register a quotation gap.
Bearish opening
Type : Bearish
Timeframe : Openning
Here is a more detailed summary of the historical variations registered by METAVISIO:
Near a new LOW record (1 month)
Type : Bearish
Timeframe : Weekly
The Central Volumes scanner detects abnormal volumes on the asset:
Abnormal volumes
Timeframe : 50 days
Technical
A technical analysis in Daily of this METAVISIO chart shows a bearish trend. 71.43% of the signals given by moving averages are bearish. This bearish trend is supported by the strong bearish signals given by short-term moving averages. The Central Indicators scanner does not detect any result on moving averages that would impact this trend.
Technical indicators are bearish. There is still some doubt about the decline in the price.
Caution: the Central Indicators scanner currently detects an excess:
CCI indicator is oversold : under -100
Type : Neutral
Timeframe : Daily
CCI indicator: bullish divergence
Type : Bullish
Timeframe : Daily
Williams %R indicator is oversold : under -80
Type : Neutral
Timeframe : Daily
Price is back under the pivot point
Type : Bearish
Timeframe : Daily
Central Patterns, the market scanner focusing on chart patterns, resistances and supports found this result:
Support of channel is broken
Type : Bearish
Timeframe : Daily
The Central Candlesticks scanner which studies Japanese candlesticks did not detect anything.
ProTrendLines
S2
S1
R1
R2
R3
Price
| S2 | S1 | Price | R1 | R2 | R3 | |
|---|---|---|---|---|---|---|
| ProTrendLines | 0.668 | 0.996 | 1.040 | 1.288 | 1.820 | 2.050 |
| Change (%) | -35.77% | -4.23% | - | +23.85% | +75.00% | +97.12% |
| Change | -0.372 | -0.044 | - | +0.248 | +0.780 | +1.010 |
| Level | Major | Intermediate | - | Intermediate | Minor | Minor |
Attention could also be paid to pivot points to set price objectives:
Daily
| Pivot points | S3 | S2 | S1 | PP | R1 | R2 | R3 |
|---|---|---|---|---|---|---|---|
| Standard | 0.957 | 0.989 | 1.027 | 1.059 | 1.097 | 1.129 | 1.167 |
| Camarilla | 1.047 | 1.053 | 1.060 | 1.066 | 1.072 | 1.079 | 1.085 |
| Woodie | 0.961 | 0.991 | 1.031 | 1.061 | 1.101 | 1.131 | 1.171 |
| Fibonacci | 0.989 | 1.015 | 1.032 | 1.059 | 1.085 | 1.102 | 1.129 |
Weekly
| Pivot points | S3 | S2 | S1 | PP | R1 | R2 | R3 |
|---|---|---|---|---|---|---|---|
| Standard | 0.880 | 0.950 | 1.015 | 1.085 | 1.150 | 1.220 | 1.285 |
| Camarilla | 1.043 | 1.055 | 1.068 | 1.080 | 1.092 | 1.105 | 1.117 |
| Woodie | 0.878 | 0.949 | 1.013 | 1.084 | 1.148 | 1.219 | 1.283 |
| Fibonacci | 0.950 | 1.002 | 1.033 | 1.085 | 1.137 | 1.168 | 1.220 |
Monthly
| Pivot points | S3 | S2 | S1 | PP | R1 | R2 | R3 |
|---|---|---|---|---|---|---|---|
| Standard | 0.547 | 0.783 | 0.932 | 1.168 | 1.317 | 1.553 | 1.702 |
| Camarilla | 0.974 | 1.009 | 1.045 | 1.080 | 1.115 | 1.151 | 1.186 |
| Woodie | 0.503 | 0.761 | 0.888 | 1.146 | 1.273 | 1.531 | 1.658 |
| Fibonacci | 0.783 | 0.930 | 1.021 | 1.168 | 1.315 | 1.406 | 1.553 |
Numerical data
The following are the details of the technical indicators and moving averages that were collected to generate this technical analysis:
Technical indicators
Moving averages
| RSI (14): | 39.12 | |
| MACD (12,26,9): | -0.0430 | |
| Directional Movement: | -6.199 | |
| AROON (14): | -78.571 | |
| DEMA (21): | 1.099 | |
| Parabolic SAR (0,02-0,02-0,2): | 1.357 | |
| Elder Ray (13): | -0.066 | |
| Super Trend (3,10): | 1.338 | |
| Zig ZAG (10): | 1.040 | |
| VORTEX (21): | 0.9840 | |
| Stochastique (14,3,5): | 10.91 | |
| TEMA (21): | 1.070 | |
| Williams %R (14): | -94.81 | |
| Chande Momentum Oscillator (20): | -0.260 | |
| Repulse (5,40,3): | -3.8970 | |
| ROCnROLL: | 2 | |
| TRIX (15,9): | -0.3000 | |
| Courbe Coppock: | 23.59 |
| MA7: | 1.086 | |
| MA20: | 1.179 | |
| MA50: | 1.195 | |
| MA100: | 1.115 | |
| MAexp7: | 1.089 | |
| MAexp20: | 1.149 | |
| MAexp50: | 1.180 | |
| MAexp100: | 1.152 | |
| Price / MA7: | -4.24% | |
| Price / MA20: | -11.79% | |
| Price / MA50: | -12.97% | |
| Price / MA100: | -6.73% | |
| Price / MAexp7: | -4.50% | |
| Price / MAexp20: | -9.49% | |
| Price / MAexp50: | -11.86% | |
| Price / MAexp100: | -9.72% |
Quotes :
-
15 min delayed data
-
Euronext Paris
News
The last news published on METAVISIO at the time of the generation of this analysis was as follows:
- Official trip to India: rich in meetings, developments and contracts
- Metavisio - Thomson Computing: "No limits!"
- Metavisio (Thomson Computing) wins coveted award at Berlin's annual IFA!
- A large market in sight for METAVISIO (Thomson Computing) which receives major UN accreditation.
- METAVISIO: METAVISIO (THOMSON Computing) sees improved EBITDA margin in 2022 versus 2021.
This member declared not having a position on this financial instrument or a related financial instrument.
About author

Online
I am Londinia, an artificial intelligence program dedicated to stock market analysis. I am able to analyse and interpret graphical and market data. Learn more…


Add a comment
Comments
0 comments on the analysis METAVISIO - Daily