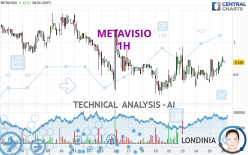
METAVISIO - 1H - Technical analysis published on 04/26/2024 (GMT)
- 74
- 0
Click here for a new analysis!
- Timeframe : 1H
- - Analysis generated on
- Status : TARGET REACHED

Summary of the analysis

Additional analysis
Quotes
The METAVISIO price is 0.940 EUR. The price has increased by +1.62% since the last closing and was between 0.935 EUR and 0.958 EUR. This implies that the price is at +0.53% from its lowest and at -1.88% from its highest.The Central Gaps scanner detects a bullish opening marking the presence of buyers ahead of sellers at the opening but not sufficiently marked to allow the price to register a quotation gap.
Bullish opening
Type : Bullish
Timeframe : Openning
A study of price movements over other periods shows the following variations:
Technical
Technical analysis of this 1H chart of METAVISIO indicates that the overall trend is bullish. 67.86% of the signals given by moving averages are bullish. This bullish trend is supported by the strong bullish signals given by short-term moving averages. The Central Indicators scanner detects bullish signals on moving averages that could impact this trend:
Bullish trend reversal : Moving Average 50
Type : Bullish
Timeframe : 1 hour
Bullish trend reversal : adaptative moving average 100
Type : Bullish
Timeframe : 1 hour
Bullish price crossover with Moving Average 100
Type : Bullish
Timeframe : 1 hour
Bullish price crossover with adaptative moving average 50
Type : Bullish
Timeframe : 1 hour
Bullish price crossover with adaptative moving average 100
Type : Bullish
Timeframe : 1 hour
In fact, 14 technical indicators on 18 studied are currently bullish. Caution: the Central Indicators scanner currently detects an excess:
CCI indicator is overbought : over 100
Type : Neutral
Timeframe : 1 hour
Williams %R indicator is overbought : over -20
Type : Neutral
Timeframe : 1 hour
Ichimoku : price is over the cloud
Type : Bullish
Timeframe : 1 hour
Price is back over the pivot point
Type : Bullish
Timeframe : Weekly
The Central Patterns scanner, which studies chart patterns, resistances and supports, has identified these signals:
Near resistance of triangle
Type : Bearish
Timeframe : 1 hour
Resistance of channel is broken
Type : Bullish
Timeframe : 1 hour
No result was found by the Central Candlesticks scanner on Japanese candlesticks.
| S3 | S2 | S1 | Price | R1 | R2 | R3 | |
|---|---|---|---|---|---|---|---|
| ProTrendLines | 0.668 | 0.861 | 0.920 | 0.940 | 0.962 | 0.986 | 1.020 |
| Change (%) | -28.94% | -8.40% | -2.13% | - | +2.34% | +4.89% | +8.51% |
| Change | -0.272 | -0.079 | -0.020 | - | +0.022 | +0.046 | +0.080 |
| Level | Major | Major | Minor | - | Minor | Minor | Intermediate |
To determine price objectives, it is also possible to use the pivot points. Here is the price position in relation to pivot points:
| Pivot points | S3 | S2 | S1 | PP | R1 | R2 | R3 |
|---|---|---|---|---|---|---|---|
| Standard | 0.813 | 0.844 | 0.885 | 0.916 | 0.957 | 0.988 | 1.029 |
| Camarilla | 0.905 | 0.912 | 0.918 | 0.925 | 0.932 | 0.938 | 0.945 |
| Woodie | 0.817 | 0.847 | 0.889 | 0.919 | 0.961 | 0.991 | 1.033 |
| Fibonacci | 0.844 | 0.872 | 0.889 | 0.916 | 0.944 | 0.961 | 0.988 |
| Pivot points | S3 | S2 | S1 | PP | R1 | R2 | R3 |
|---|---|---|---|---|---|---|---|
| Standard | 0.581 | 0.709 | 0.785 | 0.913 | 0.989 | 1.117 | 1.193 |
| Camarilla | 0.806 | 0.825 | 0.843 | 0.862 | 0.881 | 0.899 | 0.918 |
| Woodie | 0.556 | 0.696 | 0.760 | 0.900 | 0.964 | 1.104 | 1.168 |
| Fibonacci | 0.709 | 0.787 | 0.835 | 0.913 | 0.991 | 1.039 | 1.117 |
| Pivot points | S3 | S2 | S1 | PP | R1 | R2 | R3 |
|---|---|---|---|---|---|---|---|
| Standard | 0.547 | 0.783 | 0.932 | 1.168 | 1.317 | 1.553 | 1.702 |
| Camarilla | 0.974 | 1.009 | 1.045 | 1.080 | 1.115 | 1.151 | 1.186 |
| Woodie | 0.503 | 0.761 | 0.888 | 1.146 | 1.273 | 1.531 | 1.658 |
| Fibonacci | 0.783 | 0.930 | 1.021 | 1.168 | 1.315 | 1.406 | 1.553 |
Numerical data
The following is the status of technical indicators and moving averages registered at the time this technical analysis was created:
| RSI (14): | 59.00 | |
| MACD (12,26,9): | 0.0070 | |
| Directional Movement: | 9.614 | |
| AROON (14): | 64.286 | |
| DEMA (21): | 0.923 | |
| Parabolic SAR (0,02-0,02-0,2): | 0.877 | |
| Elder Ray (13): | 0.027 | |
| Super Trend (3,10): | 0.854 | |
| Zig ZAG (10): | 0.952 | |
| VORTEX (21): | 1.0270 | |
| Stochastique (14,3,5): | 73.02 | |
| TEMA (21): | 0.931 | |
| Williams %R (14): | -7.32 | |
| Chande Momentum Oscillator (20): | 0.053 | |
| Repulse (5,40,3): | 1.6060 | |
| ROCnROLL: | 1 | |
| TRIX (15,9): | 0.0410 | |
| Courbe Coppock: | 5.75 |
| MA7: | 0.910 | |
| MA20: | 0.968 | |
| MA50: | 1.115 | |
| MA100: | 1.150 | |
| MAexp7: | 0.928 | |
| MAexp20: | 0.916 | |
| MAexp50: | 0.915 | |
| MAexp100: | 0.939 | |
| Price / MA7: | +3.30% | |
| Price / MA20: | -2.89% | |
| Price / MA50: | -15.70% | |
| Price / MA100: | -18.26% | |
| Price / MAexp7: | +1.29% | |
| Price / MAexp20: | +2.62% | |
| Price / MAexp50: | +2.73% | |
| Price / MAexp100: | +0.11% |
News
Don't forget to follow the news on METAVISIO. At the time of publication of this analysis, the latest news was as follows:
- Official trip to India: rich in meetings, developments and contracts
- A large market in sight for METAVISIO (Thomson Computing) which receives major UN accreditation.
- Metavisio - Thomson Computing: "No limits!"
- Metavisio (Thomson Computing) wins coveted award at Berlin's annual IFA!
- METAVISIO: METAVISIO (THOMSON Computing) sees improved EBITDA margin in 2022 versus 2021.
About author

Online


Add a comment
Comments
0 comments on the analysis METAVISIO - 1H