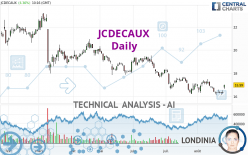
JCDECAUX - Daily - Technical analysis published on 08/25/2023 (GMT)
- 151
- 0
Click here for a new analysis!
- Timeframe : Daily
- - Analysis generated on
- Status : LEVEL MAINTAINED

Summary of the analysis

Additional analysis
Quotes
The JCDECAUX rating is 16.99 EUR. The price registered an increase of +4.30% on the session and was traded between 16.63 EUR and 17.02 EUR over the period. The price is currently at +2.16% from its lowest and -0.18% from its highest.The Central Gaps scanner detects the formation of a bullish gap marking the strong presence of buyers against sellers at the opening. This formed a quotation gap.
Opening Gap UP
Type : Bullish
Timeframe : Openning
Here is a more detailed summary of the historical variations registered by JCDECAUX:
Near a new LOW record (1st january)
Type : Bearish
Timeframe : Weekly
Near a new LOW record (1 month)
Type : Bearish
Timeframe : Weekly
Technical
A technical analysis in Daily of this JCDECAUX chart shows a bearish trend. The signals given by moving averages are 71.43% bearish. This bearish trend could slow down given the neutral signals currently being given by short-term moving averages. An assessment of moving averages reveals a bullish signal that could impact this trend:
Bullish price crossover with Moving Average 20
Type : Bullish
Timeframe : Daily
The probability of a further increase is slight given the direction of the technical indicators.
Caution: the Central Indicators scanner currently detects an excess:
MACD indicator: bullish divergence
Type : Bullish
Timeframe : Daily
Pivot points : price is over resistance 1
Type : Neutral
Timeframe : Weekly
Pivot points : price is over resistance 3
Type : Neutral
Timeframe : Daily
RSI indicator is back over 50
Type : Bullish
Timeframe : Daily
MACD crosses UP its Moving Average
Type : Bullish
Timeframe : Daily
Williams %R indicator is back over -50
Type : Bullish
Timeframe : Daily
An analysis of the price chart with the Central Patterns scanner (detector of chart patterns and resistances and supports) shows a result that can have an impact on the price change:
Near resistance of channel
Type : Bearish
Timeframe : Daily
The Central Candlesticks scanner which studies Japanese candlesticks did not detect anything.
| S3 | S2 | S1 | Price | R1 | R2 | R3 | |
|---|---|---|---|---|---|---|---|
| ProTrendLines | 11.58 | 12.90 | 15.54 | 16.99 | 17.27 | 18.49 | 19.37 |
| Change (%) | -31.84% | -24.07% | -8.53% | - | +1.65% | +8.83% | +14.01% |
| Change | -5.41 | -4.09 | -1.45 | - | +0.28 | +1.50 | +2.38 |
| Level | Minor | Major | Intermediate | - | Intermediate | Minor | Minor |
Pivot points can also be used to set your price objectives. Here is the price situation in relation to pivot points:
| Pivot points | S3 | S2 | S1 | PP | R1 | R2 | R3 |
|---|---|---|---|---|---|---|---|
| Standard | 15.83 | 16.02 | 16.15 | 16.34 | 16.47 | 16.66 | 16.79 |
| Camarilla | 16.20 | 16.23 | 16.26 | 16.29 | 16.32 | 16.35 | 16.38 |
| Woodie | 15.81 | 16.01 | 16.13 | 16.33 | 16.45 | 16.65 | 16.77 |
| Fibonacci | 16.02 | 16.14 | 16.21 | 16.34 | 16.46 | 16.53 | 16.66 |
| Pivot points | S3 | S2 | S1 | PP | R1 | R2 | R3 |
|---|---|---|---|---|---|---|---|
| Standard | 15.25 | 15.67 | 16.02 | 16.44 | 16.79 | 17.21 | 17.56 |
| Camarilla | 16.15 | 16.22 | 16.29 | 16.36 | 16.43 | 16.50 | 16.57 |
| Woodie | 15.21 | 15.65 | 15.98 | 16.42 | 16.75 | 17.19 | 17.52 |
| Fibonacci | 15.67 | 15.97 | 16.15 | 16.44 | 16.74 | 16.92 | 17.21 |
| Pivot points | S3 | S2 | S1 | PP | R1 | R2 | R3 |
|---|---|---|---|---|---|---|---|
| Standard | 13.87 | 15.04 | 16.04 | 17.21 | 18.21 | 19.38 | 20.38 |
| Camarilla | 16.45 | 16.65 | 16.85 | 17.05 | 17.25 | 17.45 | 17.65 |
| Woodie | 13.80 | 15.00 | 15.97 | 17.17 | 18.14 | 19.34 | 20.31 |
| Fibonacci | 15.04 | 15.87 | 16.38 | 17.21 | 18.04 | 18.55 | 19.38 |
Numerical data
The following are the details of the technical indicators and moving averages that were collected to generate this technical analysis:
| RSI (14): | 53.54 | |
| MACD (12,26,9): | -0.2200 | |
| Directional Movement: | 0.97 | |
| AROON (14): | -42.86 | |
| DEMA (21): | 16.42 | |
| Parabolic SAR (0,02-0,02-0,2): | 17.07 | |
| Elder Ray (13): | 0.20 | |
| Super Trend (3,10): | 17.17 | |
| Zig ZAG (10): | 16.99 | |
| VORTEX (21): | 0.9300 | |
| Stochastique (14,3,5): | 31.90 | |
| TEMA (21): | 16.47 | |
| Williams %R (14): | -36.43 | |
| Chande Momentum Oscillator (20): | -0.13 | |
| Repulse (5,40,3): | 1.8400 | |
| ROCnROLL: | -1 | |
| TRIX (15,9): | -0.2000 | |
| Courbe Coppock: | 6.46 |
| MA7: | 16.43 | |
| MA20: | 16.78 | |
| MA50: | 17.23 | |
| MA100: | 18.23 | |
| MAexp7: | 16.56 | |
| MAexp20: | 16.73 | |
| MAexp50: | 17.26 | |
| MAexp100: | 17.80 | |
| Price / MA7: | +3.41% | |
| Price / MA20: | +1.25% | |
| Price / MA50: | -1.39% | |
| Price / MA100: | -6.80% | |
| Price / MAexp7: | +2.60% | |
| Price / MAexp20: | +1.55% | |
| Price / MAexp50: | -1.56% | |
| Price / MAexp100: | -4.55% |
News
Don't forget to follow the news on JCDECAUX. At the time of publication of this analysis, the latest news was as follows:
- JCDecaux : H1 2023 Business report
- JCDecaux : H1 2023 results
- JCDecaux : Half-year liquidity contract statement for JCDECAUX SE
- JCDecaux wins the largest OOH/DOOH advertising contract in Norway with Oslo Sporveien
- JCDecaux unveils its Climate Strategy aimed at achieving Net Zero Carbon by 2050
About author
Online


Add a comment
Comments
0 comments on the analysis JCDECAUX - Daily