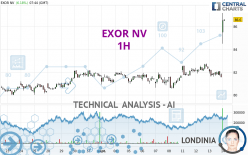
EXOR NV - 1H - Technical analysis published on 09/14/2023 (GMT)
- 120
- 0
- Timeframe : 1H
- - Analysis generated on
- Status : WITHOUT TARGET

Summary of the analysis

Additional analysis
Quotes
The EXOR NV rating is 86.66 EUR. On the day, this instrument gained +6.25% with the lowest point at 84.50 EUR and the highest point at 87.18 EUR. The deviation from the price is +2.56% for the low point and -0.60% for the high point.The Central Gaps scanner detects the formation of a bullish gap marking the strong presence of buyers against sellers at the opening. This formed a quotation gap.
Opening Gap UP
Type : Bullish
Timeframe : Openning
Here is a more detailed summary of the historical variations registered by EXOR NV:
New HIGH record (5 years)
Type : Bullish
Timeframe : Weekly
New HIGH record (1 year)
Type : Bullish
Timeframe : Weekly
New HIGH record (1st january)
Type : Bullish
Timeframe : Weekly
New HIGH record (1 month)
Type : Bullish
Timeframe : Weekly
Technical
Technical analysis of this 1H chart of EXOR NV indicates that the overall trend is strongly bullish. 92.86% of the signals given by moving averages are bullish. The overall trend is supported by the strong bullish signals from short-term moving averages. An assessment of moving averages reveals several bullish signals that could impact this trend:
Bullish price crossover with Moving Average 20
Type : Bullish
Timeframe : 1 hour
Bullish price crossover with Moving Average 50
Type : Bullish
Timeframe : 1 hour
Bullish price crossover with Moving Average 100
Type : Bullish
Timeframe : 1 hour
Bullish price crossover with adaptative moving average 20
Type : Bullish
Timeframe : 1 hour
In fact, 12 technical indicators on 18 studied are currently positioned bullish. Caution: the Central Indicators scanner currently detects an excess:
RSI indicator is overbought : over 80
Type : Neutral
Timeframe : 1 hour
CCI indicator is overbought : over 100
Type : Neutral
Timeframe : 1 hour
Williams %R indicator is overbought : over -20
Type : Neutral
Timeframe : 1 hour
Pivot points : price is over resistance 3
Type : Neutral
Timeframe : 1 hour
Pivot points : price is over resistance 3
Type : Neutral
Timeframe : Weekly
MACD crosses UP its Moving Average
Type : Bullish
Timeframe : 1 hour
Parabolic SAR indicator bullish reversal
Type : Bullish
Timeframe : 1 hour
Aroon indicator bullish trend
Type : Bullish
Timeframe : 1 hour
SuperTrend indicator bullish reversal
Type : Bullish
Timeframe : 1 hour
MACD indicator is back over 0
Type : Bullish
Timeframe : 1 hour
Momentum indicator is back over 0
Type : Bullish
Timeframe : 1 hour
Central Patterns, the market scanner focusing on chart patterns, resistances and supports found these results:
Near horizontal support
Type : Bullish
Timeframe : 1 hour
Support of channel is broken
Type : Bearish
Timeframe : 1 hour
The presence of a bullish Japanese candlestick pattern detected by Central Candlesticks that could cause a very short term rebound was also detected:
Long white line
Type : Bullish
Timeframe : 1 hour
| S3 | S2 | S1 | Price | |
|---|---|---|---|---|
| ProTrendLines | 82.18 | 82.74 | 85.20 | 86.66 |
| Change (%) | -5.17% | -4.52% | -1.68% | - |
| Change | -4.48 | -3.92 | -1.46 | - |
| Level | Intermediate | Minor | Intermediate | - |
To determine price objectives, it is also possible to use the pivot points. Here is the price position in relation to pivot points:
| Pivot points | S3 | S2 | S1 | PP | R1 | R2 | R3 |
|---|---|---|---|---|---|---|---|
| Standard | 80.60 | 81.08 | 81.32 | 81.80 | 82.04 | 82.52 | 82.76 |
| Camarilla | 81.36 | 81.43 | 81.49 | 81.56 | 81.63 | 81.69 | 81.76 |
| Woodie | 80.48 | 81.02 | 81.20 | 81.74 | 81.92 | 82.46 | 82.64 |
| Fibonacci | 81.08 | 81.36 | 81.53 | 81.80 | 82.08 | 82.25 | 82.52 |
| Pivot points | S3 | S2 | S1 | PP | R1 | R2 | R3 |
|---|---|---|---|---|---|---|---|
| Standard | 79.31 | 79.93 | 80.81 | 81.43 | 82.31 | 82.93 | 83.81 |
| Camarilla | 81.27 | 81.41 | 81.54 | 81.68 | 81.82 | 81.96 | 82.09 |
| Woodie | 79.43 | 80.00 | 80.93 | 81.50 | 82.43 | 83.00 | 83.93 |
| Fibonacci | 79.93 | 80.51 | 80.86 | 81.43 | 82.01 | 82.36 | 82.93 |
| Pivot points | S3 | S2 | S1 | PP | R1 | R2 | R3 |
|---|---|---|---|---|---|---|---|
| Standard | 72.53 | 75.69 | 78.71 | 81.87 | 84.89 | 88.05 | 91.07 |
| Camarilla | 80.04 | 80.61 | 81.17 | 81.74 | 82.31 | 82.87 | 83.44 |
| Woodie | 72.47 | 75.66 | 78.65 | 81.84 | 84.83 | 88.02 | 91.01 |
| Fibonacci | 75.69 | 78.05 | 79.51 | 81.87 | 84.23 | 85.69 | 88.05 |
Numerical data
The following are the details of the technical indicators and moving averages that were collected to generate this technical analysis:
| RSI (14): | 79.65 | |
| MACD (12,26,9): | 0.3300 | |
| Directional Movement: | 51.73 | |
| AROON (14): | 7.14 | |
| DEMA (21): | 82.72 | |
| Parabolic SAR (0,02-0,02-0,2): | 81.56 | |
| Elder Ray (13): | 3.29 | |
| Super Trend (3,10): | 83.25 | |
| Zig ZAG (10): | 86.40 | |
| VORTEX (21): | 0.9500 | |
| Stochastique (14,3,5): | 35.01 | |
| TEMA (21): | 83.03 | |
| Williams %R (14): | -9.96 | |
| Chande Momentum Oscillator (20): | 3.96 | |
| Repulse (5,40,3): | 1.6400 | |
| ROCnROLL: | 1 | |
| TRIX (15,9): | 0.0300 | |
| Courbe Coppock: | 1.01 |
| MA7: | 82.42 | |
| MA20: | 81.41 | |
| MA50: | 81.90 | |
| MA100: | 80.21 | |
| MAexp7: | 83.03 | |
| MAexp20: | 82.34 | |
| MAexp50: | 81.98 | |
| MAexp100: | 81.71 | |
| Price / MA7: | +5.14% | |
| Price / MA20: | +6.45% | |
| Price / MA50: | +5.81% | |
| Price / MA100: | +8.04% | |
| Price / MAexp7: | +4.37% | |
| Price / MAexp20: | +5.25% | |
| Price / MAexp50: | +5.71% | |
| Price / MAexp100: | +6.06% |
News
The last news published on EXOR NV at the time of the generation of this analysis was as follows:
- Exor Press Release - Tender Offer Launch
- Exor Press Release - H1 2023 Results
- Exor becomes a long-term investor in Philips supporting the company's strategy
- IMPALA AND EXOR JOIN FORCES TO DEVELOP TAGENERGY, A FAST-GROWING COMPANY IN THE RENEWABLE AND ENERGY STORAGE SECTORS
- Exor N.V.: Periodic Report on the Buyback Program
About author
Online


Add a comment
Comments
0 comments on the analysis EXOR NV - 1H