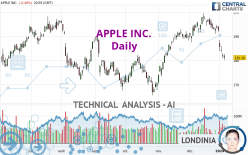
APPLE INC. - Daily - Technical analysis published on 01/08/2024 (GMT)
- 85
- 0
Click here for a new analysis!
- Timeframe : Daily
- - Analysis generated on
- Status : INVALID

Summary of the analysis

Additional analysis
Quotes
The APPLE INC. rating is 181.18 USD. The price registered a decrease of -0.40% on the session with the lowest point at 180.17 USD and the highest point at 182.76 USD. The deviation from the price is +0.56% for the low point and -0.86% for the high point.The Central Gaps scanner detects a bullish opening. A small advantage for buyers in the very short term.
Bullish opening
Type : Bullish
Timeframe : Openning
So that you have an overall view of the price change, here is a table showing the variations over several periods:
Near a new HIGH record (1st january)
Type : Bullish
Timeframe : Weekly
New LOW record (1st january)
Type : Bearish
Timeframe : Weekly
New LOW record (1 month)
Type : Bearish
Timeframe : Weekly
Technical
Technical analysis of APPLE INC. in Daily shows an overall slightly bearish trend. 53.57% of the signals given by moving averages are bearish. This slightly bearish trend could be reinforced by the strong bearish signals given by short-term moving averages. There is no crossing of moving average by the price or crossing of moving averages between themselves.
In fact, according to the parameters integrated into the Central Analyzer system, 15 technical indicators out of 18 analysed are currently bearish. Caution: the Central Indicators scanner currently detects an excess:
RSI indicator is oversold : under 30
Type : Neutral
Timeframe : Daily
CCI indicator is oversold : under -100
Type : Neutral
Timeframe : Daily
Previous candle closed under Bollinger bands
Type : Neutral
Timeframe : Daily
Williams %R indicator is oversold : under -80
Type : Neutral
Timeframe : Daily
Pivot points : price is under support 3
Type : Neutral
Timeframe : Weekly
Price is back under the pivot point
Type : Bearish
Timeframe : Daily
An analysis of the price chart with the Central Patterns scanner (detector of chart patterns and resistances and supports) shows several results that can have an impact on the price change:
Near horizontal support
Type : Bullish
Timeframe : Daily
Support of channel is broken
Type : Bearish
Timeframe : Daily
The Central Candlesticks scanner, specialised in Japanese candlesticks, did not identify any signals.
| S3 | S2 | S1 | Price | R1 | R2 | R3 | |
|---|---|---|---|---|---|---|---|
| ProTrendLines | 166.70 | 173.81 | 179.95 | 181.18 | 185.51 | 189.41 | 195.93 |
| Change (%) | -7.99% | -4.07% | -0.68% | - | +2.39% | +4.54% | +8.14% |
| Change | -14.48 | -7.37 | -1.23 | - | +4.33 | +8.23 | +14.75 |
| Level | Intermediate | Minor | Major | - | Minor | Intermediate | Major |
To determine price objectives, it is also possible to use the pivot points. Here is the price position in relation to pivot points:
| Pivot points | S3 | S2 | S1 | PP | R1 | R2 | R3 |
|---|---|---|---|---|---|---|---|
| Standard | 177.39 | 178.78 | 179.98 | 181.37 | 182.57 | 183.96 | 185.16 |
| Camarilla | 180.47 | 180.71 | 180.94 | 181.18 | 181.42 | 181.66 | 181.89 |
| Woodie | 177.30 | 178.73 | 179.89 | 181.32 | 182.48 | 183.91 | 185.07 |
| Fibonacci | 178.78 | 179.77 | 180.38 | 181.37 | 182.36 | 182.97 | 183.96 |
| Pivot points | S3 | S2 | S1 | PP | R1 | R2 | R3 |
|---|---|---|---|---|---|---|---|
| Standard | 187.29 | 189.19 | 190.86 | 192.76 | 194.43 | 196.33 | 198.00 |
| Camarilla | 191.55 | 191.88 | 192.20 | 192.53 | 192.86 | 193.19 | 193.51 |
| Woodie | 187.18 | 189.13 | 190.75 | 192.70 | 194.32 | 196.27 | 197.89 |
| Fibonacci | 189.19 | 190.55 | 191.40 | 192.76 | 194.12 | 194.97 | 196.33 |
| Pivot points | S3 | S2 | S1 | PP | R1 | R2 | R3 |
|---|---|---|---|---|---|---|---|
| Standard | 174.61 | 181.03 | 186.78 | 193.20 | 198.95 | 205.37 | 211.12 |
| Camarilla | 189.18 | 190.30 | 191.41 | 192.53 | 193.65 | 194.76 | 195.88 |
| Woodie | 174.28 | 180.86 | 186.45 | 193.03 | 198.62 | 205.20 | 210.79 |
| Fibonacci | 181.03 | 185.68 | 188.55 | 193.20 | 197.85 | 200.72 | 205.37 |
Numerical data
The following are the details of the technical indicators and moving averages that were collected to generate this technical analysis:
| RSI (14): | 28.84 | |
| MACD (12,26,9): | -1.3300 | |
| Directional Movement: | -24.16 | |
| AROON (14): | -100.00 | |
| DEMA (21): | 189.28 | |
| Parabolic SAR (0,02-0,02-0,2): | 192.44 | |
| Elder Ray (13): | -7.39 | |
| Super Trend (3,10): | 190.54 | |
| Zig ZAG (10): | 181.18 | |
| VORTEX (21): | 0.8100 | |
| Stochastique (14,3,5): | 5.37 | |
| TEMA (21): | 185.69 | |
| Williams %R (14): | -94.46 | |
| Chande Momentum Oscillator (20): | -14.71 | |
| Repulse (5,40,3): | -1.2400 | |
| ROCnROLL: | 2 | |
| TRIX (15,9): | 0.0700 | |
| Courbe Coppock: | 9.06 |
| MA7: | 187.46 | |
| MA20: | 192.64 | |
| MA50: | 187.34 | |
| MA100: | 182.22 | |
| MAexp7: | 186.17 | |
| MAexp20: | 189.87 | |
| MAexp50: | 188.03 | |
| MAexp100: | 184.21 | |
| Price / MA7: | -3.35% | |
| Price / MA20: | -5.95% | |
| Price / MA50: | -3.29% | |
| Price / MA100: | -0.57% | |
| Price / MAexp7: | -2.68% | |
| Price / MAexp20: | -4.58% | |
| Price / MAexp50: | -3.64% | |
| Price / MAexp100: | -1.64% |
News
Don't forget to follow the news on APPLE INC.. At the time of publication of this analysis, the latest news was as follows:
-
 Apple $32 Fined Million For Infringing Qualcomm Patents
-
Apple Infringed Three Qualcomm Patents
- Qualcomm Wins Patent Infringement Case Against Apple in San Diego
-
Apple Is Holding A Big Event This Month
-
Spotify Vs Apple
About author

Online


Add a comment
Comments
0 comments on the analysis APPLE INC. - Daily