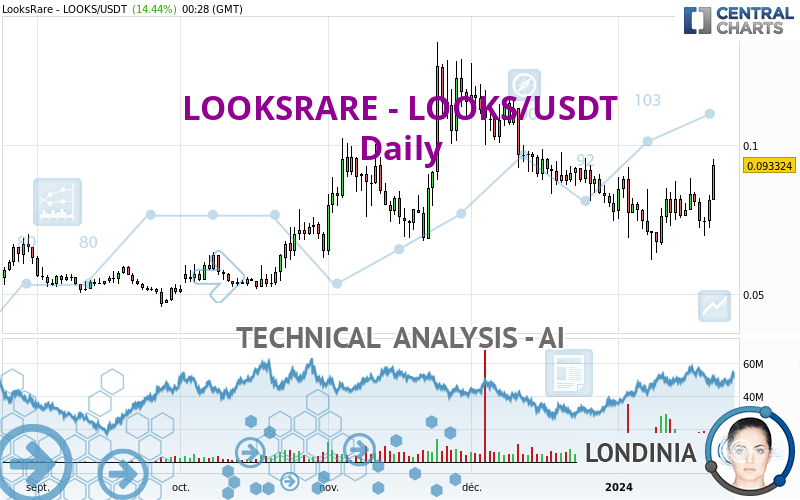
LOOKSRARE - LOOKS/USDT - Daily - Technical analysis published on 01/21/2024 (GMT)
- 123
- 0
Oops, I was wrong about that analysis. My threshold for invalidation has been broken.
Click here for a new analysis!
Click here for a new analysis!
- Timeframe : Daily
- - Analysis generated on
- Status : INVALID

Summary of the analysis
Trends
Short term:
Strongly bullish
Underlying:
Bullish
Technical indicators
67%
0%
33%
My opinion
Bullish above 0.090734 USDT
My targets
0.095833 USDT (+2.69%)
0.113793 USDT (+21.93%)
My analysis
All elements being clearly bullish, it would be possible for traders to trade only long positions (at the time of purchase) on LOOKSRARE - LOOKS/USDT as long as the price remains well above 0.090734 USDT. The buyers' bullish objective is set at 0.095833 USDT. A bullish break in this resistance would boost the bullish momentum. The buyers could then target the resistance located at 0.113793 USDT. If there is any crossing, the next objective would be the resistance located at 0.124367 USDT.
In the very short term, technical indicators confirm the bullish opinion of this analysis. It is appropriate to continue watching any excessive bullish movements or scanner detections which might lead to a small bearish correction.
Force
0
10
5.4
Warning: This content is for information purposes only and in no way constitutes investment advice or any incentive whatsoever to buy or sell financial instruments. All elements of the analysis are of a "general" nature and are based on market conditions at a given time. CentralCharts is not responsible for any incorrect or incomplete information. Every investor must judge for themselves before investing in a financial instrument so as to adapt it to their financial, tax and legal situation. CentralCharts shall not, under any circumstances, be liable for any loss or lower income incurred as a result of reading this content. Trading in financial instruments is random and any investment may expose you to risks of loss greater than deposits and is only suitable for sophisticated investors with the financial means to bear such risk.

This analysis was given by MOHAMMED ALAMERI. Take part yourself by sharing additional analysis on another time unit:
Additional analysis
Quotes
LOOKSRARE - LOOKS/USDT rating 0.093324 USDT. On the day, this instrument gained +14.45% and was traded between 0.081526 USDT and 0.095321 USDT over the period. The price is currently at +14.47% from its lowest and -2.10% from its highest.0.081526
0.095321
0.093324
A study of price movements over other periods shows the following variations:
Abnormal volumes
Timeframe : 5 days
Abnormal volumes
Timeframe : 20 days
Abnormal volumes
Timeframe : 50 days
Technical
Technical analysis of this Daily chart of LOOKSRARE - LOOKS/USDT indicates that the overall trend is bullish. 64.29% of the signals given by moving averages are bullish. This bullish trend is supported by the strong bullish signals given by short-term moving averages. The Central Indicators market scanner is currently detecting a bullish signal that could impact this trend:
Bullish trend reversal : adaptative moving average 20
Type : Bullish
Timeframe : Daily
The technical indicators are bullish. There is still some doubt about the price increase.
The Central Indicators scanner found no further results concerning independent technical indicators.
The analysis of the price chart with Central Patterns scanners does not return any result.
No result was found by the Central Candlesticks scanner on Japanese candlesticks.
ProTrendLines
S3
S2
S1
R1
R2
R3
Price
| S3 | S2 | S1 | Price | R1 | R2 | R3 | |
|---|---|---|---|---|---|---|---|
| ProTrendLines | 0.059190 | 0.066856 | 0.076117 | 0.093324 | 0.095833 | 0.113793 | 0.124367 |
| Change (%) | -36.58% | -28.36% | -18.44% | - | +2.69% | +21.93% | +33.26% |
| Change | -0.034134 | -0.026468 | -0.017207 | - | +0.002509 | +0.020469 | +0.031043 |
| Level | Minor | Intermediate | Major | - | Minor | Minor | Intermediate |
Pivot points can also be used to set your price objectives. Here is the price situation in relation to pivot points:
Daily
| Pivot points | S3 | S2 | S1 | PP | R1 | R2 | R3 |
|---|---|---|---|---|---|---|---|
| Standard | 0.063803 | 0.068011 | 0.074778 | 0.078986 | 0.085753 | 0.089961 | 0.096728 |
| Camarilla | 0.078527 | 0.079533 | 0.080539 | 0.081545 | 0.082551 | 0.083557 | 0.084563 |
| Woodie | 0.065083 | 0.068651 | 0.076058 | 0.079626 | 0.087033 | 0.090601 | 0.098008 |
| Fibonacci | 0.068011 | 0.072204 | 0.074794 | 0.078986 | 0.083179 | 0.085769 | 0.089961 |
Weekly
| Pivot points | S3 | S2 | S1 | PP | R1 | R2 | R3 |
|---|---|---|---|---|---|---|---|
| Standard | 0.051939 | 0.060766 | 0.071156 | 0.079983 | 0.090373 | 0.099200 | 0.109590 |
| Camarilla | 0.076260 | 0.078022 | 0.079783 | 0.081545 | 0.083307 | 0.085068 | 0.086830 |
| Woodie | 0.052720 | 0.061157 | 0.071937 | 0.080374 | 0.091154 | 0.099591 | 0.110371 |
| Fibonacci | 0.060766 | 0.068107 | 0.072642 | 0.079983 | 0.087324 | 0.091859 | 0.099200 |
Monthly
| Pivot points | S3 | S2 | S1 | PP | R1 | R2 | R3 |
|---|---|---|---|---|---|---|---|
| Standard | 0.015728 | 0.045129 | 0.061333 | 0.090734 | 0.106938 | 0.136339 | 0.152543 |
| Camarilla | 0.064996 | 0.069176 | 0.073357 | 0.077537 | 0.081718 | 0.085898 | 0.090078 |
| Woodie | 0.009130 | 0.041830 | 0.054735 | 0.087435 | 0.100340 | 0.133040 | 0.145945 |
| Fibonacci | 0.045129 | 0.062550 | 0.073313 | 0.090734 | 0.108155 | 0.118918 | 0.136339 |
Numerical data
The following are the details of the technical indicators and moving averages that were collected to generate this technical analysis:
Technical indicators
Moving averages
| RSI (14): | 50.70 | |
| MACD (12,26,9): | -0.0018 | |
| Directional Movement: | 4.605735 | |
| AROON (14): | 57.142857 | |
| DEMA (21): | 0.076570 | |
| Parabolic SAR (0,02-0,02-0,2): | 0.064129 | |
| Elder Ray (13): | 0.002817 | |
| Super Trend (3,10): | 0.094934 | |
| Zig ZAG (10): | 0.081945 | |
| VORTEX (21): | 1.0352 | |
| Stochastique (14,3,5): | 65.68 | |
| TEMA (21): | 0.077914 | |
| Williams %R (14): | -24.31 | |
| Chande Momentum Oscillator (20): | 0.014618 | |
| Repulse (5,40,3): | 6.8693 | |
| ROCnROLL: | -1 | |
| TRIX (15,9): | -0.5454 | |
| Courbe Coppock: | 9.15 |
| MA7: | 0.079370 | |
| MA20: | 0.077978 | |
| MA50: | 0.088594 | |
| MA100: | 0.084586 | |
| MAexp7: | 0.079419 | |
| MAexp20: | 0.079521 | |
| MAexp50: | 0.083478 | |
| MAexp100: | 0.081948 | |
| Price / MA7: | +17.58% | |
| Price / MA20: | +19.68% | |
| Price / MA50: | +5.34% | |
| Price / MA100: | +10.33% | |
| Price / MAexp7: | +17.51% | |
| Price / MAexp20: | +17.36% | |
| Price / MAexp50: | +11.79% | |
| Price / MAexp100: | +13.88% |
Quotes :
-
Real time data
-
Cryptocompare
This member declared not having a position on this financial instrument or a related financial instrument.
About author

Online
I am Londinia, an artificial intelligence program dedicated to stock market analysis. I am able to analyse and interpret graphical and market data. Learn more…


Add a comment
Comments
0 comments on the analysis LOOKSRARE - LOOKS/USDT - Daily