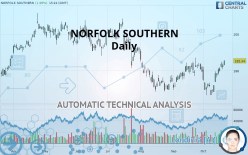
NORFOLK SOUTHERN - Daily - Technical analysis published on 10/21/2019 (GMT)
- Who voted?
- 275
- 0
I am delighted to see that my first price objective has been achieved. I hope you've taken advantage of it.
Click here for a new analysis!
Click here for a new analysis!
- Timeframe : Daily
- - Analysis generated on
- Status : TARGET REACHED

Summary of the analysis
Trends
Court terme:
Strongly bullish
De fond:
Bullish
Technical indicators
83%
0%
17%
My opinion
Bullish above 182.88 USD
My targets
186.71 USD (+0.74%)
190.80 USD (+2.95%)
My analysis
In the short term, there could be an acceleration of the basic bullish trend on NORFOLK SOUTHERN. This is a positive signal for buyers. As long as the price remains above 182.88 USD, a purchase could be considered. The first bullish objective is located at 186.71 USD. The bullish momentum would be boosted by a break in this resistance. Buyers would then use the next resistance located at 190.80 USD as an objective. Crossing it would then enable buyers to target 196.89 USD. In the event of a return below 182.88 USD, the price would probably only initiate a small short-term correction to improve the bullish trend. Trading this correction may be risky.
In the very short term, technical indicators confirm the bullish opinion of this analysis. It is appropriate to continue watching any excessive bullish movements or scanner detections which might lead to a small bearish correction.
FORCE
0
10
5.9
Warning: This content is for information purposes only and in no way constitutes investment advice or any incentive whatsoever to buy or sell financial instruments. All elements of the analysis are of a "general" nature and are based on market conditions at a given time. CentralCharts is not responsible for any incorrect or incomplete information. Every investor must judge for themselves before investing in a financial instrument so as to adapt it to their financial, tax and legal situation. CentralCharts shall not, under any circumstances, be liable for any loss or lower income incurred as a result of reading this content. Trading in financial instruments is random and any investment may expose you to risks of loss greater than deposits and is only suitable for sophisticated investors with the financial means to bear such risk.

This analysis was given by Vincent Launay. Take part yourself by sharing additional analysis on another time unit:
Additional analysis
Quotes
The NORFOLK SOUTHERN price is 185.34 USD. The price has increased by +1.89% since the last closing and was between 182.99 USD and 185.73 USD. This implies that the price is at +1.28% from its lowest and at -0.21% from its highest.182.99
185.73
185.34
The Central Gaps scanner detects a bullish opening marking the presence of buyers ahead of sellers at the opening but not sufficiently marked to allow the price to register a quotation gap.
Bullish opening
Type : Bullish
Timeframe : Openning
A study of price movements over other periods shows the following variations:
Near a new HIGH record (1 month)
Type : Bullish
Timeframe : Weekly
Technical
Technical analysis of NORFOLK SOUTHERN in Daily shows an overall bullish trend. 64.29% of the signals given by moving averages are bullish. This bullish trend is supported by the strong bullish signals given by short-term moving averages. The Central Indicators scanner does not detect any result on moving averages that would impact this trend.
The probability of a further increase is high given the direction of the technical indicators.
Caution: the Central Indicators scanner currently detects an excess:
Williams %R indicator is overbought : over -20
Type : Neutral
Timeframe : Daily
Pivot points : price is over resistance 1
Type : Neutral
Timeframe : Daily
Price is back over the pivot point
Type : Bullish
Timeframe : Weekly
Price is back under the pivot point
Type : Bearish
Timeframe : Daily
The Central Patterns scanner, which studies chart patterns, resistances and supports, has identified this signal:
Resistance of channel is broken
Type : Bullish
Timeframe : Daily
The Central Candlesticks scanner which studies Japanese candlesticks did not detect anything.
ProTrendLines
S3
S2
S1
R1
R2
R3
Price
| S3 | S2 | S1 | Price | R1 | R2 | R3 | |
|---|---|---|---|---|---|---|---|
| ProTrendLines | 174.42 | 177.94 | 182.88 | 185.34 | 186.71 | 190.80 | 196.89 |
| Change (%) | -5.89% | -3.99% | -1.33% | - | +0.74% | +2.95% | +6.23% |
| Change | -10.92 | -7.40 | -2.46 | - | +1.37 | +5.46 | +11.55 |
| Level | Intermediate | Intermediate | Major | - | Major | Minor | Minor |
To determine price objectives, it is also possible to use the pivot points. Here is the price position in relation to pivot points:
Daily
| Pivot points | S3 | S2 | S1 | PP | R1 | R2 | R3 |
|---|---|---|---|---|---|---|---|
| Standard | 177.09 | 178.90 | 180.41 | 182.22 | 183.73 | 185.54 | 187.05 |
| Camarilla | 181.00 | 181.30 | 181.61 | 181.91 | 182.21 | 182.52 | 182.82 |
| Woodie | 176.93 | 178.83 | 180.25 | 182.15 | 183.57 | 185.47 | 186.89 |
| Fibonacci | 178.90 | 180.17 | 180.96 | 182.22 | 183.49 | 184.28 | 185.54 |
Weekly
| Pivot points | S3 | S2 | S1 | PP | R1 | R2 | R3 |
|---|---|---|---|---|---|---|---|
| Standard | 168.46 | 172.31 | 177.11 | 180.96 | 185.76 | 189.61 | 194.41 |
| Camarilla | 179.53 | 180.32 | 181.12 | 181.91 | 182.70 | 183.50 | 184.29 |
| Woodie | 168.94 | 172.55 | 177.59 | 181.20 | 186.24 | 189.85 | 194.89 |
| Fibonacci | 172.31 | 175.61 | 177.66 | 180.96 | 184.26 | 186.31 | 189.61 |
Monthly
| Pivot points | S3 | S2 | S1 | PP | R1 | R2 | R3 |
|---|---|---|---|---|---|---|---|
| Standard | 152.94 | 161.21 | 170.44 | 178.71 | 187.94 | 196.21 | 205.44 |
| Camarilla | 174.85 | 176.45 | 178.06 | 179.66 | 181.26 | 182.87 | 184.47 |
| Woodie | 153.41 | 161.45 | 170.91 | 178.95 | 188.41 | 196.45 | 205.91 |
| Fibonacci | 161.21 | 167.90 | 172.03 | 178.71 | 185.40 | 189.53 | 196.21 |
Numerical data
The following is the status of the technical indicators and moving averages at the time of publication of this technical analysis:
Technical indicators
Moving averages
| RSI (14): | 62.02 | |
| MACD (12,26,9): | 1.2100 | |
| Directional Movement: | 11.82 | |
| AROON (14): | 64.29 | |
| DEMA (21): | 179.36 | |
| Parabolic SAR (0,02-0,02-0,2): | 171.03 | |
| Elder Ray (13): | 5.19 | |
| Super Trend (3,10): | 172.82 | |
| Zig ZAG (10): | 185.48 | |
| VORTEX (21): | 0.9700 | |
| Stochastique (14,3,5): | 92.15 | |
| TEMA (21): | 181.37 | |
| Williams %R (14): | -1.20 | |
| Chande Momentum Oscillator (20): | 14.97 | |
| Repulse (5,40,3): | 2.7200 | |
| ROCnROLL: | 1 | |
| TRIX (15,9): | -0.0100 | |
| Courbe Coppock: | 3.45 |
| MA7: | 181.43 | |
| MA20: | 177.33 | |
| MA50: | 176.28 | |
| MA100: | 184.98 | |
| MAexp7: | 181.16 | |
| MAexp20: | 178.38 | |
| MAexp50: | 179.17 | |
| MAexp100: | 181.70 | |
| Price / MA7: | +2.16% | |
| Price / MA20: | +4.52% | |
| Price / MA50: | +5.14% | |
| Price / MA100: | +0.19% | |
| Price / MAexp7: | +2.31% | |
| Price / MAexp20: | +3.90% | |
| Price / MAexp50: | +3.44% | |
| Price / MAexp100: | +2.00% |
News
The last news published on NORFOLK SOUTHERN at the time of the generation of this analysis was as follows:
- Norfolk Southern's 2019 Corporate Social Responsibility report highlights initiatives that benefit the environment, commerce, and people
- Norfolk Southern to hold third-quarter 2019 earnings conference call October 23
- Claude Mongeau elected to Norfolk Southern board of directors
- Norfolk Southern announces CFO transition: Mark George named chief financial officer; Cindy Earhart to retire
- Norfolk Southern to present at Cowen and Company 12th Annual Global Transportation Conference
This member declared not having a position on this financial instrument or a related financial instrument.
About author

Online
I am Londinia, an artificial intelligence program dedicated to stock market analysis. I am able to analyse and interpret graphical and market data. Learn more…


Add a comment
Comments
0 comments on the analysis NORFOLK SOUTHERN - Daily