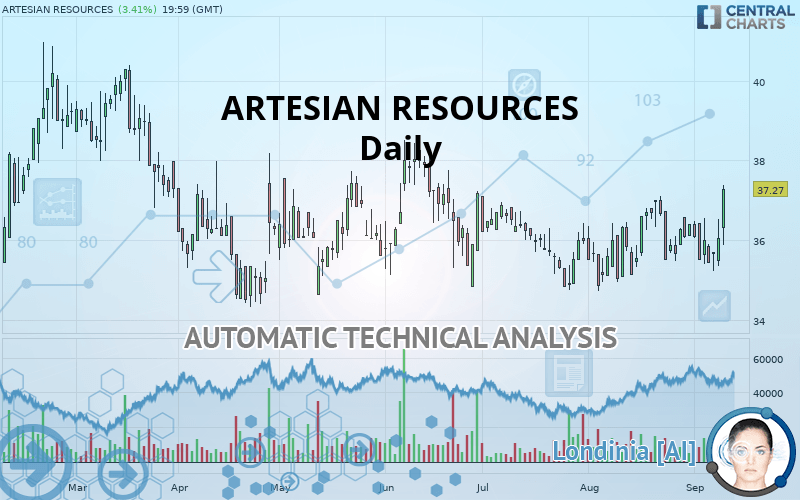
ARTESIAN RESOURCES - Daily - Technical analysis published on 09/12/2019 (GMT)
- Who voted?
- 233
- 0
Click here for a new analysis!
- Timeframe : Daily
- - Analysis generated on
- Status : TARGET REACHED

Summary of the analysis

Additional analysis
Quotes
ARTESIAN RESOURCES rating 37.27 USD. The price has increased by +3.41% since the last closing and was between 35.87 USD and 37.37 USD. This implies that the price is at +3.90% from its lowest and at -0.27% from its highest.The Central Gaps scanner detects a bullish opening. A small advantage for buyers in the very short term.
Bullish opening
Type : Bullish
Timeframe : Openning
Here is a more detailed summary of the historical variations registered by ARTESIAN RESOURCES:
Near a new LOW record (1 month)
Type : Bearish
Timeframe : Weekly
Technical
A technical analysis in Daily of this ARTESIAN RESOURCES chart shows a bullish trend. 75% of the signals given by moving averages are bullish. The overall trend is reinforced by the strong bullish signals from short-term moving averages. The Central Indicators scanner detects bullish signals on moving averages that could impact this trend:
Bullish trend reversal : adaptative moving average 20
Type : Bullish
Timeframe : Daily
Bullish trend reversal : adaptative moving average 50
Type : Bullish
Timeframe : Daily
Bullish price crossover with Moving Average 100
Type : Bullish
Timeframe : Daily
Bullish price crossover with adaptative moving average 20
Type : Bullish
Timeframe : Daily
Bullish price crossover with adaptative moving average 50
Type : Bullish
Timeframe : Daily
Bullish price crossover with adaptative moving average 100
Type : Bullish
Timeframe : Daily
In fact, according to the parameters integrated into the Central Analyzer system, 13 technical indicators out of 18 analysed are currently bullish. Caution: the Central Indicators scanner currently detects an excess:
CCI indicator is overbought : over 100
Type : Neutral
Timeframe : Daily
Williams %R indicator is overbought : over -20
Type : Neutral
Timeframe : Daily
Pivot points : price is over resistance 2
Type : Neutral
Timeframe : Daily
Pivot points : price is over resistance 2
Type : Neutral
Timeframe : Weekly
MACD crosses UP its Moving Average
Type : Bullish
Timeframe : Daily
Aroon indicator bullish trend
Type : Bullish
Timeframe : Daily
Ichimoku : price is over the cloud
Type : Bullish
Timeframe : Daily
MACD indicator is back over 0
Type : Bullish
Timeframe : Daily
Price is back under the pivot point
Type : Bearish
Timeframe : Weekly
Momentum indicator is back over 0
Type : Bullish
Timeframe : Daily
Williams %R indicator is back over -50
Type : Bullish
Timeframe : Daily
The analysis of the price chart with Central Patterns scanners does not return any result.
No result was found by the Central Candlesticks scanner on Japanese candlesticks.
| S3 | S2 | S1 | Price | R1 | R2 | R3 | |
|---|---|---|---|---|---|---|---|
| ProTrendLines | 34.86 | 36.38 | 37.00 | 37.27 | 37.58 | 38.25 | 39.28 |
| Change (%) | -6.47% | -2.39% | -0.72% | - | +0.83% | +2.63% | +5.39% |
| Change | -2.41 | -0.89 | -0.27 | - | +0.31 | +0.98 | +2.01 |
| Level | Major | Minor | Intermediate | - | Minor | Intermediate | Minor |
To determine price objectives, it is also possible to use the pivot points. Here is the price position in relation to pivot points:
| Pivot points | S3 | S2 | S1 | PP | R1 | R2 | R3 |
|---|---|---|---|---|---|---|---|
| Standard | 34.24 | 34.79 | 35.42 | 35.97 | 36.60 | 37.15 | 37.78 |
| Camarilla | 35.72 | 35.82 | 35.93 | 36.04 | 36.15 | 36.26 | 36.36 |
| Woodie | 34.27 | 34.81 | 35.45 | 35.99 | 36.63 | 37.17 | 37.81 |
| Fibonacci | 34.79 | 35.24 | 35.52 | 35.97 | 36.42 | 36.70 | 37.15 |
| Pivot points | S3 | S2 | S1 | PP | R1 | R2 | R3 |
|---|---|---|---|---|---|---|---|
| Standard | 33.87 | 34.63 | 35.02 | 35.79 | 36.18 | 36.95 | 37.34 |
| Camarilla | 35.10 | 35.21 | 35.31 | 35.42 | 35.53 | 35.63 | 35.74 |
| Woodie | 33.68 | 34.54 | 34.84 | 35.70 | 36.00 | 36.85 | 37.16 |
| Fibonacci | 34.63 | 35.07 | 35.34 | 35.79 | 36.23 | 36.50 | 36.95 |
| Pivot points | S3 | S2 | S1 | PP | R1 | R2 | R3 |
|---|---|---|---|---|---|---|---|
| Standard | 32.65 | 33.68 | 35.04 | 36.07 | 37.43 | 38.46 | 39.82 |
| Camarilla | 35.74 | 35.96 | 36.18 | 36.40 | 36.62 | 36.84 | 37.06 |
| Woodie | 32.82 | 33.76 | 35.21 | 36.15 | 37.60 | 38.54 | 39.99 |
| Fibonacci | 33.68 | 34.59 | 35.16 | 36.07 | 36.98 | 37.55 | 38.46 |
Numerical data
The following are the details of the technical indicators and moving averages that were collected to generate this technical analysis:
| RSI (14): | 59.71 | |
| MACD (12,26,9): | 0.0800 | |
| Directional Movement: | 11.00 | |
| AROON (14): | 14.29 | |
| DEMA (21): | 36.14 | |
| Parabolic SAR (0,02-0,02-0,2): | 35.23 | |
| Elder Ray (13): | 0.51 | |
| Super Trend (3,10): | 34.74 | |
| Zig ZAG (10): | 37.27 | |
| VORTEX (21): | 1.0000 | |
| Stochastique (14,3,5): | 54.41 | |
| TEMA (21): | 36.24 | |
| Williams %R (14): | -4.67 | |
| Chande Momentum Oscillator (20): | 1.76 | |
| Repulse (5,40,3): | 4.4900 | |
| ROCnROLL: | 1 | |
| TRIX (15,9): | 0.0100 | |
| Courbe Coppock: | 0.89 |
| MA7: | 36.00 | |
| MA20: | 36.10 | |
| MA50: | 35.97 | |
| MA100: | 36.16 | |
| MAexp7: | 36.21 | |
| MAexp20: | 36.06 | |
| MAexp50: | 36.07 | |
| MAexp100: | 36.21 | |
| Price / MA7: | +3.53% | |
| Price / MA20: | +3.24% | |
| Price / MA50: | +3.61% | |
| Price / MA100: | +3.07% | |
| Price / MAexp7: | +2.93% | |
| Price / MAexp20: | +3.36% | |
| Price / MAexp50: | +3.33% | |
| Price / MAexp100: | +2.93% |
News
The latest news and videos published on ARTESIAN RESOURCES at the time of the analysis were as follows:
- RushNet, Inc., Using the Robust Mineral Properties of its Ownership Interest in Deep Artesian Wells, Will Also Produce its Recently Trademarked KO™ and KOPunch™, Including a New Energy Drink with a Non-Caffeinated Version
- RushNet, Inc., with its Ownership Interest in Deep Artesian Wells, Will Produce KnockoutPunch™, Awater™ and Ewater™
- Abattis Signs LOI with Canadian Artesian Ice, Bottlers of Clearly Canadian Products, to Manufacture CBD-infused Mineral Water
-
 Artesian Resources
- Artesian Resources Corporation Declares Common Stock Dividend
About author

Online


Add a comment
Comments
0 comments on the analysis ARTESIAN RESOURCES - Daily