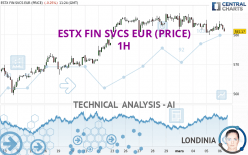
ESTX FIN SVCS EUR (PRICE) - 1H - Technical analysis published on 03/06/2024 (GMT)
- 76
- 0
Click here for a new analysis!
- Timeframe : 1H
- - Analysis generated on
- Status : TARGET REACHED

Summary of the analysis

Additional analysis
Quotes
The ESTX FIN SVCS EUR (PRICE) rating is 582.31 EUR. The price registered a decrease of -0.05% on the session and was traded between 581.65 EUR and 584.62 EUR over the period. The price is currently at +0.11% from its lowest and -0.40% from its highest.The Central Gaps scanner detects a bearish opening marking the presence of sellers ahead of buyers at the opening but not sufficiently marked to allow the price to register a quotation gap.
Bearish opening
Type : Bearish
Timeframe : Openning
Here is a more detailed summary of the historical variations registered by ESTX FIN SVCS EUR (PRICE):
Near a new HIGH record (5 years)
Type : Bullish
Timeframe : Weekly
Near a new HIGH record (1 year)
Type : Bullish
Timeframe : Weekly
Near a new HIGH record (1st january)
Type : Bullish
Timeframe : Weekly
Near a new LOW record (1 month)
Type : Bearish
Timeframe : Weekly
Technical
Technical analysis of ESTX FIN SVCS EUR (PRICE) in 1H shows a neutral overall trend. This indecision could turn into a bearish trend due to the strong bearish signals currently being given by short-term moving averages. The Central Indicators scanner detects bearish signals on moving averages that could impact this trend:
Bearish trend reversal : adaptative moving average 20
Type : Bearish
Timeframe : 1 hour
Bearish trend reversal : adaptative moving average 50
Type : Bearish
Timeframe : 1 hour
Bearish price crossover with Moving Average 20
Type : Bearish
Timeframe : 1 hour
Bearish price crossover with adaptative moving average 100
Type : Bearish
Timeframe : 1 hour
An assessment of technical indicators does not currently provide any relevant information to suggest whether the signal given by the technical indicators is more bullish or bearish.
Other results related to technical indicators were also found by the Central Indicators scanner:
RSI indicator is back under 50
Type : Bearish
Timeframe : 1 hour
Price is back under the pivot point
Type : Bearish
Timeframe : Weekly
Williams %R indicator is back under -50
Type : Bearish
Timeframe : 1 hour
No signals are given by Central Patterns, a market scanner specialised in chart patterns, resistances and supports.
The Central Candlesticks scanner which studies Japanese candlesticks did not detect anything.
| S3 | S2 | S1 | Price | R1 | R2 | |
|---|---|---|---|---|---|---|
| ProTrendLines | 569.89 | 579.83 | 581.95 | 582.31 | 587.38 | 596.44 |
| Change (%) | -2.13% | -0.43% | -0.06% | - | +0.87% | +2.43% |
| Change | -12.42 | -2.48 | -0.36 | - | +5.07 | +14.13 |
| Level | Major | Intermediate | Minor | - | Intermediate | Major |
Attention could also be paid to pivot points to set price objectives:
| Pivot points | S3 | S2 | S1 | PP | R1 | R2 | R3 |
|---|---|---|---|---|---|---|---|
| Standard | 574.83 | 577.38 | 580.00 | 582.55 | 585.17 | 587.72 | 590.34 |
| Camarilla | 581.20 | 581.67 | 582.15 | 582.62 | 583.09 | 583.57 | 584.04 |
| Woodie | 574.87 | 577.40 | 580.04 | 582.57 | 585.21 | 587.74 | 590.38 |
| Fibonacci | 577.38 | 579.36 | 580.58 | 582.55 | 584.53 | 585.75 | 587.72 |
| Pivot points | S3 | S2 | S1 | PP | R1 | R2 | R3 |
|---|---|---|---|---|---|---|---|
| Standard | 575.12 | 578.02 | 581.61 | 584.51 | 588.10 | 591.00 | 594.59 |
| Camarilla | 583.43 | 584.02 | 584.62 | 585.21 | 585.81 | 586.40 | 587.00 |
| Woodie | 575.48 | 578.19 | 581.97 | 584.68 | 588.46 | 591.17 | 594.95 |
| Fibonacci | 578.02 | 580.50 | 582.03 | 584.51 | 586.99 | 588.52 | 591.00 |
| Pivot points | S3 | S2 | S1 | PP | R1 | R2 | R3 |
|---|---|---|---|---|---|---|---|
| Standard | 539.40 | 549.42 | 567.27 | 577.29 | 595.14 | 605.16 | 623.01 |
| Camarilla | 577.47 | 580.02 | 582.58 | 585.13 | 587.69 | 590.24 | 592.79 |
| Woodie | 543.33 | 551.38 | 571.20 | 579.25 | 599.07 | 607.12 | 626.94 |
| Fibonacci | 549.42 | 560.06 | 566.64 | 577.29 | 587.93 | 594.51 | 605.16 |
Numerical data
The following are the details of the technical indicators and moving averages that were collected to generate this technical analysis:
| RSI (14): | 45.09 | |
| MACD (12,26,9): | -0.4300 | |
| Directional Movement: | -3.55 | |
| AROON (14): | -14.28 | |
| DEMA (21): | 582.17 | |
| Parabolic SAR (0,02-0,02-0,2): | 580.44 | |
| Elder Ray (13): | 0.01 | |
| Super Trend (3,10): | 585.70 | |
| Zig ZAG (10): | 581.80 | |
| VORTEX (21): | 0.8900 | |
| Stochastique (14,3,5): | 57.45 | |
| TEMA (21): | 581.98 | |
| Williams %R (14): | -61.12 | |
| Chande Momentum Oscillator (20): | -1.47 | |
| Repulse (5,40,3): | -0.2400 | |
| ROCnROLL: | 2 | |
| TRIX (15,9): | -0.0200 | |
| Courbe Coppock: | 0.20 |
| MA7: | 583.81 | |
| MA20: | 575.98 | |
| MA50: | 565.68 | |
| MA100: | 540.24 | |
| MAexp7: | 582.42 | |
| MAexp20: | 582.77 | |
| MAexp50: | 582.88 | |
| MAexp100: | 580.61 | |
| Price / MA7: | -0.26% | |
| Price / MA20: | +1.10% | |
| Price / MA50: | +2.94% | |
| Price / MA100: | +7.79% | |
| Price / MAexp7: | -0.02% | |
| Price / MAexp20: | -0.08% | |
| Price / MAexp50: | -0.10% | |
| Price / MAexp100: | +0.29% |
About author
Online


Add a comment
Comments
0 comments on the analysis ESTX FIN SVCS EUR (PRICE) - 1H