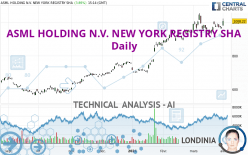
ASML HOLDING N.V. NEW YORK REGISTRY SHA - Daily - Technical analysis published on 04/01/2024 (GMT)
- 102
- 0
Click here for a new analysis!
- Timeframe : Daily
- - Analysis generated on
- Status : INVALID

Summary of the analysis

Additional analysis
Quotes
The ASML HOLDING N.V. NEW YORK REGISTRY SHA rating is 1,008.22 USD. The price has increased by +3.89% since the last closing with the lowest point at 980.90 USD and the highest point at 1,022.66 USD. The deviation from the price is +2.79% for the low point and -1.41% for the high point.A bullish gap was detected at the opening by the Central Gaps scanner. There are a lot of buyers and they have the upper hand in the very short term.
Opening Gap UP
Type : Bullish
Timeframe : Openning
A study of price movements over other periods shows the following variations:
Near a new HIGH record (5 years)
Type : Bullish
Timeframe : Weekly
Near a new HIGH record (1 year)
Type : Bullish
Timeframe : Weekly
Near a new HIGH record (1st january)
Type : Bullish
Timeframe : Weekly
Near a new HIGH record (1 month)
Type : Bullish
Timeframe : Weekly
Technical
A technical analysis in Daily of this ASML HOLDING N.V. NEW YORK REGISTRY SHA chart shows a strongly bullish trend. 92.86% of the signals given by moving averages are bullish. This strongly bullish trend is supported by the strong bullish signals given by short-term moving averages. The Central Indicators scanner detects a bullish signal on moving averages that could impact this trend:
Bullish price crossover with Moving Average 20
Type : Bullish
Timeframe : Daily
In fact, 12 technical indicators on 18 studied are currently positioned bullish. But beware of excesses. The Central Indicators scanner currently detects this:
Williams %R indicator is overbought : over -20
Type : Neutral
Timeframe : Daily
Pivot points : price is over resistance 2
Type : Neutral
Timeframe : Weekly
Pivot points : price is over resistance 3
Type : Neutral
Timeframe : Daily
Parabolic SAR indicator bullish reversal
Type : Bullish
Timeframe : Daily
Aroon indicator bullish trend
Type : Bullish
Timeframe : Daily
Momentum indicator is back over 0
Type : Bullish
Timeframe : Daily
Central Patterns, the market scanner focusing on chart patterns, resistances and supports found these results:
Near resistance of channel
Type : Bearish
Timeframe : Daily
Horizontal resistance is broken
Type : Bullish
Timeframe : Daily
Resistance of triangle is broken
Type : Bullish
Timeframe : Daily
Central Candlesticks, the scanner specialised in Japanese candlesticks, detects these bullish signals that could support the hypothesis of a small rebound in the very short term:
White morning star
Type : Bullish
Timeframe : Daily
Upside gap
Type : Bullish
Timeframe : Daily
| S3 | S2 | S1 | Price | R1 | |
|---|---|---|---|---|---|
| ProTrendLines | 871.92 | 940.21 | 990.79 | 1,008.22 | 1,047.39 |
| Change (%) | -13.52% | -6.75% | -1.73% | - | +3.89% |
| Change | -136.30 | -68.01 | -17.43 | - | +39.17 |
| Level | Major | Major | Intermediate | - | Major |
To determine price objectives, it is also possible to use the pivot points. Here is the price position in relation to pivot points:
| Pivot points | S3 | S2 | S1 | PP | R1 | R2 | R3 |
|---|---|---|---|---|---|---|---|
| Standard | 953.90 | 957.78 | 964.12 | 968.00 | 974.34 | 978.22 | 984.56 |
| Camarilla | 967.66 | 968.60 | 969.53 | 970.47 | 971.41 | 972.34 | 973.28 |
| Woodie | 955.14 | 958.40 | 965.36 | 968.62 | 975.58 | 978.84 | 985.80 |
| Fibonacci | 957.78 | 961.68 | 964.09 | 968.00 | 971.90 | 974.31 | 978.22 |
| Pivot points | S3 | S2 | S1 | PP | R1 | R2 | R3 |
|---|---|---|---|---|---|---|---|
| Standard | 926.69 | 944.17 | 957.32 | 974.80 | 987.95 | 1,005.43 | 1,018.58 |
| Camarilla | 962.05 | 964.86 | 967.66 | 970.47 | 973.28 | 976.09 | 978.89 |
| Woodie | 924.53 | 943.09 | 955.16 | 973.72 | 985.79 | 1,004.35 | 1,016.42 |
| Fibonacci | 944.17 | 955.87 | 963.10 | 974.80 | 986.50 | 993.73 | 1,005.43 |
| Pivot points | S3 | S2 | S1 | PP | R1 | R2 | R3 |
|---|---|---|---|---|---|---|---|
| Standard | 785.19 | 856.60 | 913.53 | 984.94 | 1,041.87 | 1,113.28 | 1,170.21 |
| Camarilla | 935.18 | 946.94 | 958.71 | 970.47 | 982.24 | 994.00 | 1,005.76 |
| Woodie | 777.96 | 852.98 | 906.30 | 981.32 | 1,034.64 | 1,109.66 | 1,162.98 |
| Fibonacci | 856.60 | 905.62 | 935.91 | 984.94 | 1,033.96 | 1,064.25 | 1,113.28 |
Numerical data
The following is the status of the technical indicators and moving averages at the time of publication of this technical analysis:
| RSI (14): | 61.65 | |
| MACD (12,26,9): | 15.4600 | |
| Directional Movement: | 15.24 | |
| AROON (14): | 57.14 | |
| DEMA (21): | 992.70 | |
| Parabolic SAR (0,02-0,02-0,2): | 928.00 | |
| Elder Ray (13): | 25.57 | |
| Super Trend (3,10): | 1,029.43 | |
| Zig ZAG (10): | 1,008.23 | |
| VORTEX (21): | 0.9700 | |
| Stochastique (14,3,5): | 60.94 | |
| TEMA (21): | 981.41 | |
| Williams %R (14): | -12.87 | |
| Chande Momentum Oscillator (20): | 41.70 | |
| Repulse (5,40,3): | 2.5900 | |
| ROCnROLL: | 1 | |
| TRIX (15,9): | 0.2600 | |
| Courbe Coppock: | 1.00 |
| MA7: | 981.94 | |
| MA20: | 978.32 | |
| MA50: | 930.86 | |
| MA100: | 817.94 | |
| MAexp7: | 981.41 | |
| MAexp20: | 969.59 | |
| MAexp50: | 920.38 | |
| MAexp100: | 847.77 | |
| Price / MA7: | +2.68% | |
| Price / MA20: | +3.06% | |
| Price / MA50: | +8.31% | |
| Price / MA100: | +23.26% | |
| Price / MAexp7: | +2.73% | |
| Price / MAexp20: | +3.98% | |
| Price / MAexp50: | +9.54% | |
| Price / MAexp100: | +18.93% |
About author
Online


Add a comment
Comments
0 comments on the analysis ASML HOLDING N.V. NEW YORK REGISTRY SHA - Daily