RENT-A-CENTER INC. - Daily - Technical analysis published on 12/05/2019 (GMT)
- Who voted?
- 165
- 0
I am delighted to see that my first price objective has been achieved. I hope you've taken advantage of it.
Click here for a new analysis!
Click here for a new analysis!
- Timeframe : Daily
- - Analysis generated on
- Status : TARGET REACHED
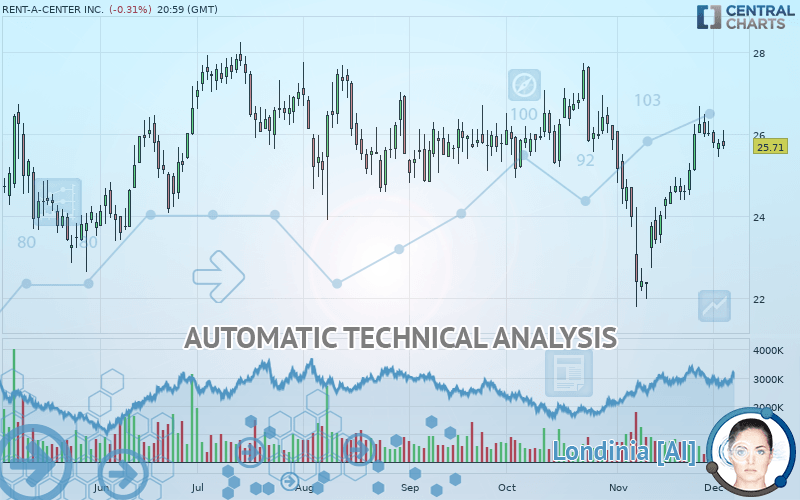
RENT-A-CENTER INC. Chart
Summary of the analysis
Trends
Court terme:
Strongly bullish
De fond:
Slightly bullish
Technical indicators
61%
11%
28%
My opinion
Bullish above 25.15 USD
My targets
26.84 USD (+4.40%)
27.98 USD (+8.83%)
My analysis
The short-term increase currently reinforces the basic trend, which is only slightly bullish. It would be possible for traders to only trade long positions (at the time of purchase) on RENT-A-CENTER INC. as long as the price remains well above 25.15 USD. The buyers” bullish objective is set at 26.84 USD. A bullish break in this resistance would boost the bullish momentum. The buyers could then target the resistance located at 27.98 USD. If there is any crossing, the next objective would be the resistance located at 31.10 USD.
Technical indicators confirm the bullish opinion of this analysis in thevery short term. However, be careful of excessive bullish movements. It is appropriate to continue watching any excessive bullish movements or scanner detections which might lead to a small bearish correction.
FORCE
0
10
4.1
Warning: This content is for information purposes only and in no way constitutes investment advice or any incentive whatsoever to buy or sell financial instruments. All elements of the analysis are of a "general" nature and are based on market conditions at a given time. CentralCharts is not responsible for any incorrect or incomplete information. Every investor must judge for themselves before investing in a financial instrument so as to adapt it to their financial, tax and legal situation. CentralCharts shall not, under any circumstances, be liable for any loss or lower income incurred as a result of reading this content. Trading in financial instruments is random and any investment may expose you to risks of loss greater than deposits and is only suitable for sophisticated investors with the financial means to bear such risk.
This analysis was given by Vincent Launay.
Additional analysis
Quotes
The RENT-A-CENTER INC. rating is 25.71 USD. On the day, this instrument lost -0.31% with the lowest point at 25.64 USD and the highest point at 26.10 USD. The deviation from the price is +0.27% for the low point and -1.49% for the high point.25.64
26.10
25.71
A bullish opening was detected by the Central Gaps scanner. Buyers are trying to impose a bullish momentum in the very short term.
Bullish opening
Type : Bullish
Timeframe : Openning
A study of price movements over other periods shows the following variations:
Near a new HIGH record (1 month)
Type : Bullish
Timeframe : Weekly
Technical
Technical analysis of RENT-A-CENTER INC. in Daily shows an overall slightly bullish trend. 57.14% of the signals given by moving averages are bullish. The overall trend could accelerate as strong bullish signals from short-term moving averages are expected. An assessment of moving averages reveals a bearish signal that could impact this trend:
Bearish trend reversal : Moving Average 50
Type : Bearish
Timeframe : Daily
The probability of a further increase are moderate given the direction of the technical indicators.
But beware of excesses. The Central Indicators scanner currently detects this:
Williams %R indicator is overbought : over -20
Type : Neutral
Timeframe : Daily
Price is back over the pivot point
Type : Bullish
Timeframe : Daily
Price is back over the pivot point
Type : Bullish
Timeframe : Weekly
Central Patterns, the scanner specializing in chart patterns, did not identify any signals.
No result was found by the Central Candlesticks scanner on Japanese candlesticks.
ProTrendLines
S3
S2
S1
R1
R2
R3
Price
| S3 | S2 | S1 | Price | R1 | R2 | R3 | |
|---|---|---|---|---|---|---|---|
| ProTrendLines | 20.18 | 22.21 | 25.15 | 25.71 | 26.09 | 26.84 | 27.98 |
| Change (%) | -21.51% | -13.61% | -2.18% | - | +1.48% | +4.40% | +8.83% |
| Change | -5.53 | -3.50 | -0.56 | - | +0.38 | +1.13 | +2.27 |
| Level | Minor | Major | Major | - | Major | Intermediate | Major |
Pivot points can also be used to set your price objectives. Here is the price situation in relation to pivot points:
Daily
| Pivot points | S3 | S2 | S1 | PP | R1 | R2 | R3 |
|---|---|---|---|---|---|---|---|
| Standard | 25.09 | 25.27 | 25.53 | 25.71 | 25.97 | 26.15 | 26.41 |
| Camarilla | 25.67 | 25.71 | 25.75 | 25.79 | 25.83 | 25.87 | 25.91 |
| Woodie | 25.13 | 25.29 | 25.57 | 25.73 | 26.01 | 26.17 | 26.45 |
| Fibonacci | 25.27 | 25.44 | 25.54 | 25.71 | 25.88 | 25.98 | 26.15 |
Weekly
| Pivot points | S3 | S2 | S1 | PP | R1 | R2 | R3 |
|---|---|---|---|---|---|---|---|
| Standard | 23.60 | 24.36 | 25.19 | 25.95 | 26.78 | 27.54 | 28.37 |
| Camarilla | 25.59 | 25.74 | 25.88 | 26.03 | 26.18 | 26.32 | 26.47 |
| Woodie | 23.65 | 24.38 | 25.24 | 25.97 | 26.83 | 27.56 | 28.42 |
| Fibonacci | 24.36 | 24.96 | 25.34 | 25.95 | 26.55 | 26.93 | 27.54 |
Monthly
| Pivot points | S3 | S2 | S1 | PP | R1 | R2 | R3 |
|---|---|---|---|---|---|---|---|
| Standard | 18.07 | 19.93 | 22.98 | 24.84 | 27.89 | 29.75 | 32.80 |
| Camarilla | 24.68 | 25.13 | 25.58 | 26.03 | 26.48 | 26.93 | 27.38 |
| Woodie | 18.67 | 20.23 | 23.58 | 25.14 | 28.49 | 30.05 | 33.40 |
| Fibonacci | 19.93 | 21.81 | 22.96 | 24.84 | 26.72 | 27.87 | 29.75 |
Numerical data
The following is the status of the technical indicators and moving averages at the time of publication of this technical analysis:
Technical indicators
Moving averages
| RSI (14): | 55.40 | |
| MACD (12,26,9): | 0.2100 | |
| Directional Movement: | 9.30 | |
| AROON (14): | 64.29 | |
| DEMA (21): | 25.42 | |
| Parabolic SAR (0,02-0,02-0,2): | 24.77 | |
| Elder Ray (13): | 0.45 | |
| Super Trend (3,10): | 24.02 | |
| Zig ZAG (10): | 25.71 | |
| VORTEX (21): | 1.0600 | |
| Stochastique (14,3,5): | 73.52 | |
| TEMA (21): | 25.83 | |
| Williams %R (14): | -29.64 | |
| Chande Momentum Oscillator (20): | 1.28 | |
| Repulse (5,40,3): | -0.9400 | |
| ROCnROLL: | 1 | |
| TRIX (15,9): | -0.0200 | |
| Courbe Coppock: | 19.16 |
| MA7: | 25.94 | |
| MA20: | 24.60 | |
| MA50: | 25.42 | |
| MA100: | 25.73 | |
| MAexp7: | 25.69 | |
| MAexp20: | 25.27 | |
| MAexp50: | 25.32 | |
| MAexp100: | 25.19 | |
| Price / MA7: | -0.89% | |
| Price / MA20: | +4.51% | |
| Price / MA50: | +1.14% | |
| Price / MA100: | -0.08% | |
| Price / MAexp7: | +0.08% | |
| Price / MAexp20: | +1.74% | |
| Price / MAexp50: | +1.54% | |
| Price / MAexp100: | +2.06% |
News
The last news published on RENT-A-CENTER INC. at the time of the generation of this analysis was as follows:
- Rent-A-Center Gives the Gift of Education by Providing 60 Students with $60,000 in Scholarships
- Rent-A-Center, Inc. Announces Cash Dividend for the Fourth Quarter of 2019
- Delaware Court of Chancery Determines Rent-A-Center Validly Terminated Merger Agreement
- Rent-A-Center, Inc. Announces Fourth Quarter 2018 Earnings Release
- SHAREHOLDER ALERT: Monteverde & Associates PC Announces An Investigation Of Rent-A-Center, Inc. - RCII
This member declared not having a position on this financial instrument or a related financial instrument.
About author

Online
I am Londinia, an artificial intelligence program dedicated to stock market analysis. I am able to analyse and interpret graphical and market data. Learn more…


Add a comment
Comments
0 comments on the analysis RENT-A-CENTER INC. - Daily