SEAGEN INC. - Daily - Technical analysis published on 07/11/2019 (GMT)
- Who voted?
- 263
- 0
Click here for a new analysis!
- Timeframe : Daily
- - Analysis generated on
- Status : TARGET REACHED
Summary of the analysis
Additional analysis
Quotes
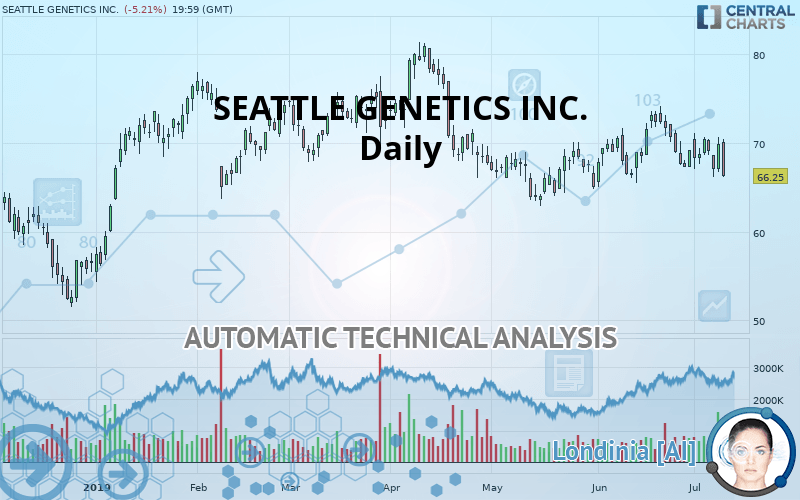
SEATTLE GENETICS INC. rating 66.25 USD. On the day, this instrument lost -5.21% and was traded between 66.15 USD and 70.44 USD over the period. The price is currently at +0.15% from its lowest and -5.95% from its highest.A bullish opening was detected by the Central Gaps scanner. Buyers are trying to impose a bullish momentum in the very short term.
Bullish opening
Type : Bullish
Timeframe : Openning
So that you have an overall view of the price change, here is a table showing the variations over several periods:
Near a new LOW record (1 month)
Type : Bearish
Timeframe : Weekly
Technical
Technical analysis of this Daily chart of SEATTLE GENETICS INC. indicates that the overall trend is strongly bearish. The signals given by moving averages are 89.29% bearish. This strong bearish trend is confirmed by the strong signals currently being given by short-term moving averages. The Central Indicators market scanner is currently detecting several bullish signals that could impact this trend:
Bullish price crossover with Moving Average 20
Type : Bullish
Timeframe : Daily
Bullish price crossover with Moving Average 50
Type : Bullish
Timeframe : Daily
Bullish price crossover with adaptative moving average 20
Type : Bullish
Timeframe : Daily
Bullish price crossover with adaptative moving average 50
Type : Bullish
Timeframe : Daily
Bullish price crossover with adaptative moving average 100
Type : Bullish
Timeframe : Daily
An assessment of technical indicators shows a strong bearish signal.
But beware of excesses. The Central Indicators scanner currently detects this:
MACD indicator: bullish divergence
Type : Bullish
Timeframe : Daily
Pivot points : price is under support 1
Type : Neutral
Timeframe : Daily
Pivot points : price is under support 1
Type : Neutral
Timeframe : Weekly
RSI indicator is back over 50
Type : Bullish
Timeframe : Daily
Price is back over the pivot point
Type : Bullish
Timeframe : Daily
The Central Patterns scanner, which studies chart patterns, resistances and supports, has identified these signals:
Support of channel is broken
Type : Bearish
Timeframe : Daily
Support of triangle is broken
Type : Bearish
Timeframe : Daily
Central Candlesticks, the scanner specialised in Japanese candlesticks, detects a bearish signal that could support the hypothesis of a small drop in the very short term:
Downside Tasuki gap
Type : Bearish
Timeframe : Daily
| S3 | S2 | S1 | Price | R1 | R2 | R3 | |
|---|---|---|---|---|---|---|---|
| ProTrendLines | 58.14 | 60.95 | 63.99 | 66.25 | 68.98 | 73.71 | 77.04 |
| Change (%) | -12.24% | -8.00% | -3.41% | - | +4.12% | +11.26% | +16.29% |
| Change | -8.11 | -5.30 | -2.26 | - | +2.73 | +7.46 | +10.79 |
| Level | Minor | Minor | Major | - | Intermediate | Major | Intermediate |
Attention could also be paid to pivot points to set price objectives:
| Pivot points | S3 | S2 | S1 | PP | R1 | R2 | R3 |
|---|---|---|---|---|---|---|---|
| Standard | 63.61 | 65.18 | 67.53 | 69.10 | 71.45 | 73.02 | 75.37 |
| Camarilla | 68.81 | 69.17 | 69.53 | 69.89 | 70.25 | 70.61 | 70.97 |
| Woodie | 64.01 | 65.38 | 67.93 | 69.30 | 71.85 | 73.22 | 75.77 |
| Fibonacci | 65.18 | 66.67 | 67.60 | 69.10 | 70.59 | 71.52 | 73.02 |
| Pivot points | S3 | S2 | S1 | PP | R1 | R2 | R3 |
|---|---|---|---|---|---|---|---|
| Standard | 63.05 | 65.08 | 67.07 | 69.10 | 71.09 | 73.12 | 75.11 |
| Camarilla | 67.95 | 68.31 | 68.68 | 69.05 | 69.42 | 69.79 | 70.16 |
| Woodie | 63.02 | 65.07 | 67.04 | 69.09 | 71.06 | 73.11 | 75.08 |
| Fibonacci | 65.08 | 66.62 | 67.57 | 69.10 | 70.64 | 71.59 | 73.12 |
Numerical data
The following is the status of technical indicators and moving averages registered at the time this technical analysis was created:
| RSI (14): | 43.31 | |
| MACD (12,26,9): | -0.2300 | |
| Directional Movement: | 4.15 | |
| AROON (14): | -92.86 | |
| DEMA (21): | 68.70 | |
| Parabolic SAR (0,02-0,02-0,2): | 71.18 | |
| Elder Ray (13): | -0.43 | |
| Super Trend (3,10): | 66.19 | |
| Zig ZAG (10): | 66.25 | |
| VORTEX (21): | 0.9600 | |
| Stochastique (14,3,5): | 19.87 | |
| TEMA (21): | 68.49 | |
| Williams %R (14): | -98.75 | |
| Chande Momentum Oscillator (20): | -5.49 | |
| Repulse (5,40,3): | -6.0500 | |
| ROCnROLL: | 2 | |
| TRIX (15,9): | 0.0300 | |
| Courbe Coppock: | 6.33 |
| MA7: | 68.55 | |
| MA20: | 69.45 | |
| MA50: | 68.17 | |
| MA100: | 70.63 | |
| MAexp7: | 68.32 | |
| MAexp20: | 68.87 | |
| MAexp50: | 69.16 | |
| MAexp100: | 69.36 | |
| Price / MA7: | -3.36% | |
| Price / MA20: | -4.61% | |
| Price / MA50: | -2.82% | |
| Price / MA100: | -6.20% | |
| Price / MAexp7: | -3.03% | |
| Price / MAexp20: | -3.80% | |
| Price / MAexp50: | -4.21% | |
| Price / MAexp100: | -4.48% |
News
The latest news and videos published on SEATTLE GENETICS INC. at the time of the analysis were as follows:
- Astellas and Seattle Genetics Announce Antibody-Drug Conjugate Enfortumab Vedotin Produced Tumor Response Rate of 44 Percent in Patients with Most Common Type of Advanced Urothelial (Bladder) Cancer
- Seattle Genetics and Astellas Announce Antibody-Drug Conjugate Enfortumab Vedotin Produced Tumor Response Rate of 44 Percent in Patients with Most Common Type of Advanced Urothelial (Bladder) Cancer
- Seattle Genetics and Astellas Announce Positive Topline Results from Pivotal Trial of Enfortumab Vedotin in Locally Advanced or Metastatic Urothelial Cancer
- Seattle Genetics to Present at Cowen and Company 39th Annual Health Care Conference
- Seattle Genetics Achieves $30 Million Milestone Payment for European Commission Approval of ADCETRIS® (Brentuximab Vedotin) in Frontline Hodgkin Lymphoma
About author

Online


Add a comment
Comments
0 comments on the analysis SEAGEN INC. - Daily